| Map | Pie | Office | Total | D | R | I | Margin | %Margin | Dem | Rep | Ind | Oth. | Dem | Rep | Ind | Other | | | | | | | | | | | | | | | | | | |
|---|
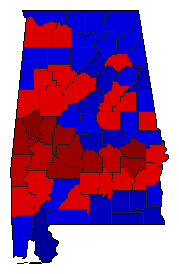
 |  | Senator |
1,485,499 |
2 |
1 |
0 |
452,562 |
30.47% |
34.71% |
65.18% |
0.00% |
0.11% |
515,619 |
968,181 |
0 |
1,699 |
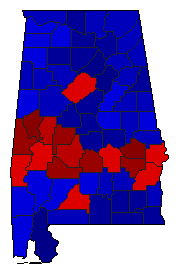
 |  | Governor |
1,494,273 |
2 |
1 |
0 |
234,762 |
15.71% |
41.87% |
57.58% |
0.00% |
0.54% |
625,710 |
860,472 |
0 |
8,091 |
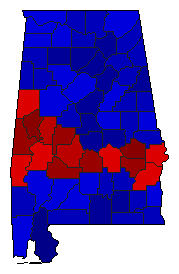
 | | Lt. Governor |
1,477,090 |
2 |
1 |
0 |
45,160 |
3.06% |
48.47% |
51.53% |
0.00% |
0.00% |
715,965 |
761,125 |
0 |
0 |
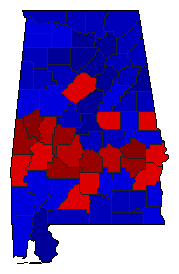
 | | Secretary of State |
1,450,152 |
2 |
1 |
0 |
357,890 |
24.68% |
37.66% |
62.34% |
0.00% |
0.00% |
546,131 |
904,021 |
0 |
0 |
 | | State Treasurer |
1,457,895 |
2 |
1 |
0 |
296,465 |
20.34% |
39.83% |
60.17% |
0.00% |
0.00% |
580,715 |
877,180 |
0 |
0 |
 | | Attorney General |
1,476,075 |
2 |
1 |
0 |
262,250 |
17.77% |
41.07% |
58.84% |
0.00% |
0.09% |
606,270 |
868,520 |
0 |
1,285 |
 | | State Auditor |
1,425,763 |
2 |
1 |
0 |
361,996 |
25.39% |
37.26% |
62.65% |
0.00% |
0.09% |
531,233 |
893,229 |
0 |
1,301 |
 | | Agriculture Commissioner |
1,447,561 |
2 |
1 |
0 |
279,646 |
19.32% |
40.29% |
59.61% |
0.00% |
0.10% |
583,255 |
862,901 |
0 |
1,405 |
| | | Map | Pie | Initiative | Total Vote | N | | Y | Margin | %Margin | No | | Yes | Oth. | No | | Yes | |
 | | Referendum |
1,113,369 |
1 |
0 |
2 |
107,917 |
9.69% |
54.85% |
0.00% |
45.15% |
0.00% |
610,643 |
0 |
502,726 |
0 |
 | | Referendum |
1,158,882 |
1 |
0 |
2 |
53,832 |
4.65% |
52.32% |
0.00% |
47.68% |
0.00% |
606,357 |
0 |
552,525 |
0 |
 | | Referendum |
1,232,357 |
1 |
0 |
2 |
172,323 |
13.98% |
56.99% |
0.00% |
43.01% |
0.00% |
702,340 |
0 |
530,017 |
0 |
 | | Referendum |
943,031 |
1 |
0 |
2 |
6,703 |
0.71% |
50.36% |
0.00% |
49.64% |
0.00% |
474,867 |
0 |
468,164 |
0 |
|
