| Map | Pie | Office | Total | D | R | I | Margin | %Margin | Dem | Rep | Ind | Oth. | Dem | Rep | Ind | Other | | | | | | | | | | | | | | | | | | |
|---|
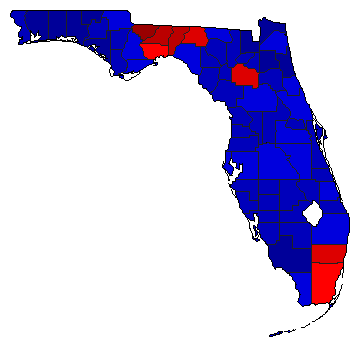
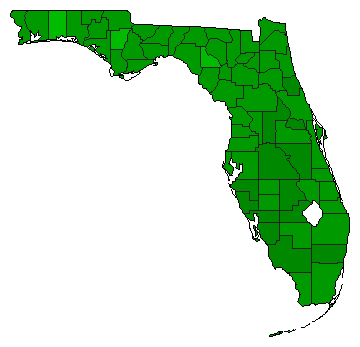
 |  | Senator |
5,411,106 |
3 |
1 |
2 |
1,038,194 |
19.19% |
20.20% |
48.89% |
29.71% |
1.20% |
1,092,936 |
2,645,743 |
1,607,549 |
64,878 |
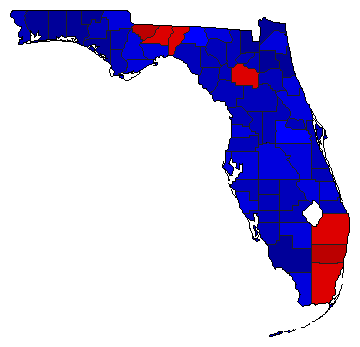
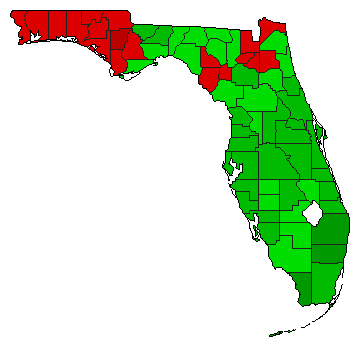
 |  | Governor |
5,359,735 |
2 |
1 |
3 |
61,550 |
1.15% |
47.72% |
48.87% |
2.31% |
1.10% |
2,557,785 |
2,619,335 |
123,831 |
58,784 |
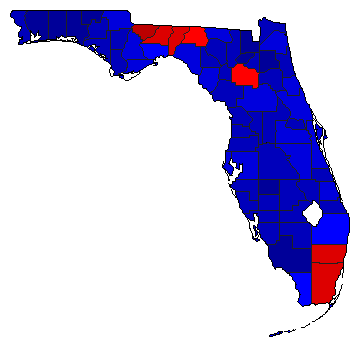
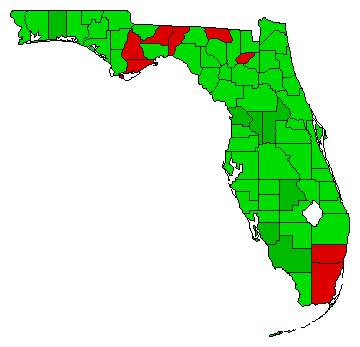
 | | State Treasurer |
5,175,782 |
2 |
1 |
0 |
951,473 |
18.38% |
38.94% |
57.33% |
0.00% |
3.73% |
2,015,579 |
2,967,052 |
0 |
193,151 |
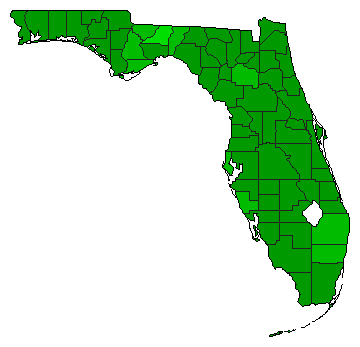
 | | Attorney General |
5,263,392 |
2 |
1 |
3 |
701,491 |
13.33% |
41.44% |
54.77% |
3.78% |
0.00% |
2,181,377 |
2,882,868 |
199,147 |
0 |
 |  | Agriculture Commissioner |
5,198,678 |
2 |
1 |
3 |
924,809 |
17.79% |
38.15% |
55.94% |
3.92% |
2.00% |
1,983,277 |
2,908,086 |
203,598 |
103,717 |
| | | Map | Pie | Initiative | Total Vote | N | | Y | Margin | %Margin | No | | Yes | Oth. | No | | Yes | |
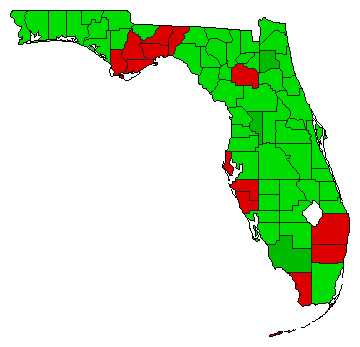 | | Referendum |
4,929,680 |
2 |
0 |
1 |
245,406 |
4.98% |
47.51% |
0.00% |
52.49% |
0.00% |
2,342,137 |
0 |
2,587,543 |
0 |
 | | Referendum |
5,058,579 |
2 |
0 |
1 |
2,814,473 |
55.64% |
22.18% |
0.00% |
77.82% |
0.00% |
1,122,053 |
0 |
3,936,526 |
0 |
 | | Referendum |
5,106,381 |
1 |
0 |
2 |
1,742,027 |
34.11% |
67.06% |
0.00% |
32.94% |
0.00% |
3,424,204 |
0 |
1,682,177 |
0 |
 | | Referendum |
5,041,009 |
2 |
0 |
1 |
1,269,289 |
25.18% |
37.41% |
0.00% |
62.59% |
0.00% |
1,885,860 |
0 |
3,155,149 |
0 |
 | | Referendum |
5,010,947 |
2 |
0 |
1 |
1,295,451 |
25.85% |
37.07% |
0.00% |
62.93% |
0.00% |
1,857,748 |
0 |
3,153,199 |
0 |
 | | Referendum |
5,049,879 |
2 |
0 |
1 |
453,877 |
8.99% |
45.51% |
0.00% |
54.49% |
0.00% |
2,298,001 |
0 |
2,751,878 |
0 |
 | | Referendum |
4,901,981 |
2 |
0 |
1 |
2,147,277 |
43.80% |
28.10% |
0.00% |
71.90% |
0.00% |
1,377,352 |
0 |
3,524,629 |
0 |
|
