| Map | Pie | Year | Total | D | R | I | Margin | %Margin | Dem | Rep | Ind | Oth. | Dem | Rep | Ind | Other | | | | | | | | | | | | | | | | | | |
|---|
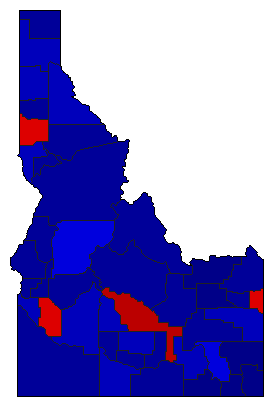
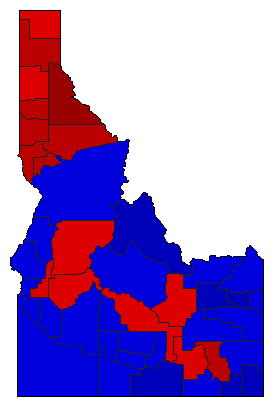
|  | 2022 |
584,405 |
2 |
1 |
0 |
198,122 |
33.90% |
30.48% |
64.38% |
0.00% |
5.13% |
178,147 |
376,269 |
0 |
29,989 |
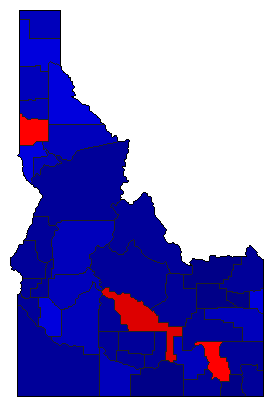
 |  | 2018 |
596,867 |
2 |
1 |
0 |
116,157 |
19.46% |
40.27% |
59.73% |
0.00% |
0.00% |
240,355 |
356,512 |
0 |
0 |
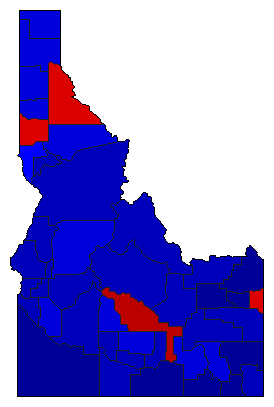
 | | 2014 |
431,890 |
2 |
1 |
3 |
129,351 |
29.95% |
32.86% |
62.81% |
4.33% |
0.00% |
141,917 |
271,268 |
18,705 |
0 |
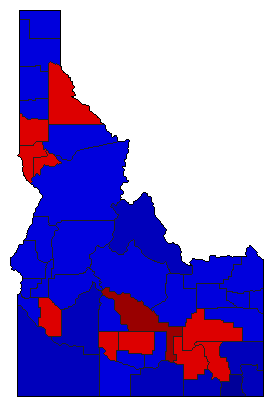
 | | 2010 |
442,160 |
2 |
1 |
0 |
179,805 |
40.67% |
27.18% |
67.84% |
0.00% |
4.98% |
120,174 |
299,979 |
0 |
22,007 |
 | | 2006 |
445,420 |
2 |
1 |
0 |
84,336 |
18.93% |
39.36% |
58.29% |
0.00% |
2.35% |
175,312 |
259,648 |
0 |
10,460 |
 | | 2002 |
402,017 |
2 |
1 |
0 |
65,579 |
16.31% |
39.91% |
56.22% |
0.00% |
3.87% |
160,438 |
226,017 |
0 |
15,562 |
 | | 1998 |
375,161 |
2 |
1 |
0 |
92,016 |
24.53% |
35.63% |
60.16% |
0.00% |
4.20% |
133,688 |
225,704 |
0 |
15,769 |
 | | 1994 |
404,634 |
2 |
1 |
0 |
21,384 |
5.28% |
47.36% |
52.64% |
0.00% |
0.00% |
191,625 |
213,009 |
0 |
0 |
 | | 1990 |
246,132 |
0 |
1 |
0 |
246,132 |
100.00% |
0.00% |
100.00% |
0.00% |
0.00% |
0 |
246,132 |
0 |
0 |
 | | 1986 |
378,864 |
2 |
1 |
0 |
2,692 |
0.71% |
49.64% |
50.36% |
0.00% |
0.00% |
188,086 |
190,778 |
0 |
0 |
|
