| Map | Pie | Year | Total | D | R | I | Margin | %Margin | Dem | Rep | Ind | Oth. | Dem | Rep | Ind | Other | | | | | | | | | | | | | | | | | | |
|---|
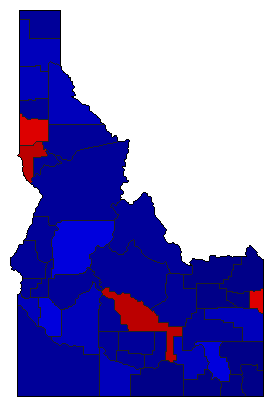
|  | 2022 |
580,912 |
2 |
1 |
0 |
259,756 |
44.72% |
27.40% |
72.12% |
0.00% |
0.48% |
159,189 |
418,945 |
0 |
2,778 |
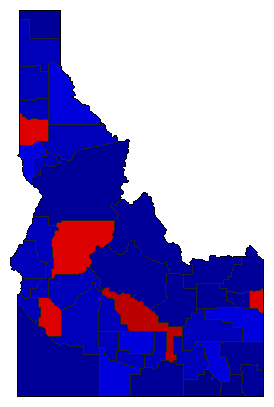
 |  | 2018 |
592,690 |
2 |
1 |
0 |
141,682 |
23.90% |
38.05% |
61.95% |
0.00% |
0.00% |
225,504 |
367,186 |
0 |
0 |
 | | 2014 |
430,204 |
2 |
1 |
0 |
53,498 |
12.44% |
43.78% |
56.22% |
0.00% |
0.00% |
188,353 |
241,851 |
0 |
0 |
 | | 2010 |
439,617 |
2 |
1 |
0 |
213,289 |
48.52% |
25.74% |
74.26% |
0.00% |
0.00% |
113,164 |
326,453 |
0 |
0 |
 | | 2006 |
364,871 |
0 |
1 |
0 |
364,871 |
100.00% |
0.00% |
100.00% |
0.00% |
0.00% |
0 |
364,871 |
0 |
0 |
 | | 2002 |
383,626 |
0 |
1 |
0 |
210,752 |
54.94% |
0.00% |
77.47% |
0.00% |
22.53% |
0 |
297,189 |
0 |
86,437 |
 | | 1998 |
372,438 |
2 |
1 |
0 |
153,171 |
41.13% |
27.77% |
68.90% |
0.00% |
3.34% |
103,423 |
256,594 |
0 |
12,421 |
 | | 1994 |
398,514 |
2 |
1 |
0 |
135,564 |
34.02% |
32.99% |
67.01% |
0.00% |
0.00% |
131,475 |
267,039 |
0 |
0 |
 | | 1990 |
247,908 |
0 |
1 |
0 |
247,908 |
100.00% |
0.00% |
100.00% |
0.00% |
0.00% |
0 |
247,908 |
0 |
0 |
 | | 1986 |
295,014 |
0 |
1 |
0 |
295,014 |
100.00% |
0.00% |
100.00% |
0.00% |
0.00% |
0 |
295,014 |
0 |
0 |
|
