| Map | Pie | Year | Total | D | R | I | Margin | %Margin | Dem | Rep | Ind | Oth. | Dem | Rep | Ind | Other | | | | | | | | | | | | | | | | | | |
|---|
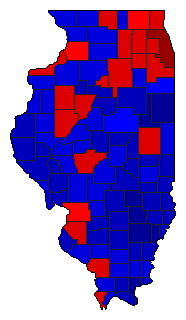
|  | 2022 |
4,085,184 |
1 |
2 |
0 |
655,077 |
16.04% |
57.08% |
41.04% |
0.00% |
1.88% |
2,331,714 |
1,676,637 |
0 |
76,833 |
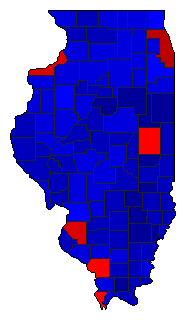
 |  | 2018 |
4,533,671 |
1 |
2 |
0 |
1,038,429 |
22.90% |
59.90% |
37.00% |
0.00% |
3.10% |
2,715,812 |
1,677,383 |
0 |
140,476 |
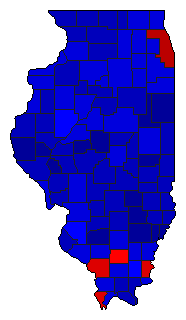
 |  | 2016 |
5,412,543 |
1 |
2 |
0 |
271,521 |
5.02% |
49.45% |
44.43% |
0.00% |
6.13% |
2,676,244 |
2,404,723 |
0 |
331,576 |
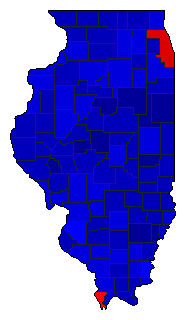
 | | 2014 |
3,583,286 |
2 |
1 |
3 |
139,390 |
3.89% |
45.67% |
49.56% |
4.76% |
0.00% |
1,636,593 |
1,775,983 |
170,534 |
176 |
 | | 2010 |
3,662,182 |
2 |
1 |
4 |
429,876 |
11.74% |
40.88% |
52.62% |
3.19% |
3.31% |
1,497,263 |
1,927,139 |
116,712 |
121,068 |
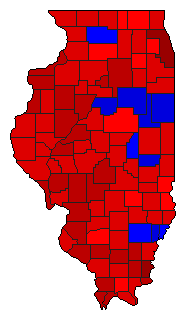 | | 2006 |
3,422,128 |
1 |
2 |
0 |
1,121,118 |
32.76% |
64.25% |
31.49% |
0.00% |
4.26% |
2,198,658 |
1,077,540 |
0 |
145,930 |
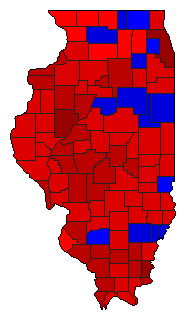 | | 2002 |
3,403,475 |
1 |
2 |
0 |
1,041,441 |
30.60% |
63.18% |
32.58% |
0.00% |
4.23% |
2,150,425 |
1,108,984 |
0 |
144,066 |
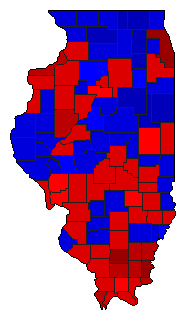 | | 1998 |
3,232,352 |
1 |
2 |
3 |
614,413 |
19.01% |
58.63% |
39.63% |
1.74% |
0.00% |
1,895,273 |
1,280,860 |
56,219 |
0 |
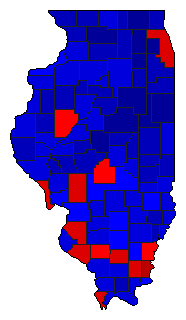 | | 1994 |
2,936,321 |
2 |
1 |
0 |
406,994 |
13.86% |
41.14% |
55.00% |
0.00% |
3.85% |
1,208,128 |
1,615,122 |
0 |
113,071 |
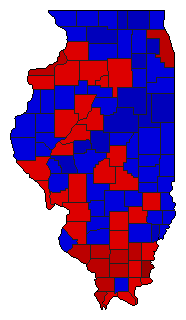 | | 1990 |
3,137,161 |
1 |
2 |
0 |
255,667 |
8.15% |
54.07% |
45.93% |
0.00% |
0.00% |
1,696,414 |
1,440,747 |
0 |
0 |
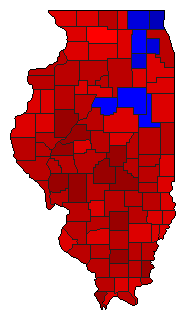 | | 1986 |
3,066,151 |
1 |
2 |
3 |
805,490 |
26.27% |
61.33% |
35.06% |
2.56% |
1.06% |
1,880,413 |
1,074,923 |
78,389 |
32,426 |
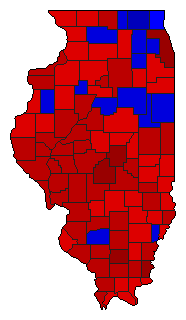 |  | 1982 |
3,612,949 |
1 |
2 |
0 |
1,117,312 |
30.93% |
64.43% |
33.50% |
0.00% |
2.07% |
2,327,779 |
1,210,467 |
0 |
74,703 |
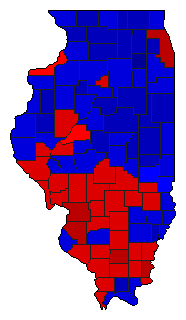 |  | 1978 |
2,985,988 |
1 |
2 |
0 |
153,934 |
5.16% |
51.67% |
46.52% |
0.00% |
1.81% |
1,542,983 |
1,389,049 |
0 |
53,956 |
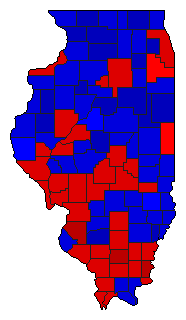 |  | 1976 |
4,455,624 |
1 |
2 |
0 |
180,097 |
4.04% |
51.58% |
47.53% |
0.00% |
0.89% |
2,298,074 |
2,117,977 |
0 |
39,573 |
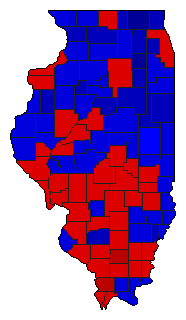 |  | 1972 |
4,334,647 |
2 |
1 |
0 |
122,642 |
2.83% |
48.33% |
51.16% |
0.00% |
0.52% |
2,094,798 |
2,217,440 |
0 |
22,409 |
|