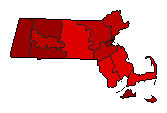
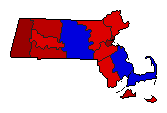
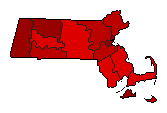
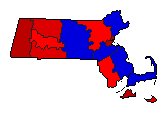
2010 General Election Results Comparison - Massachusetts
| Map | Pie | Office | Total | D | R | I | Margin | %Margin | Dem | Rep | Ind | Oth. | Dem | Rep | Ind | Other |
| Governor | 2,297,137 | 1 | 2 | 3 | 148,385 | 6.46% | 48.47% | 42.01% | 8.03% | 1.50% | 1,113,336 | 964,951 | 184,387 | 34,463 | ||
 | Secretary of State | 2,213,586 | 1 | 2 | 0 | 701,600 | 31.70% | 64.41% | 32.72% | 0.00% | 2.87% | 1,425,864 | 724,264 | 0 | 63,458 | |
 | State Treasurer | 2,211,887 | 1 | 2 | 0 | 215,439 | 9.74% | 54.83% | 45.09% | 0.00% | 0.08% | 1,212,770 | 997,331 | 0 | 1,786 | |
 | Attorney General | 2,267,887 | 1 | 2 | 0 | 579,460 | 25.55% | 62.73% | 37.18% | 0.00% | 0.09% | 1,422,680 | 843,220 | 0 | 1,987 | |
 | State Auditor | 2,129,679 | 1 | 2 | 0 | 45,488 | 2.14% | 48.44% | 46.31% | 0.00% | 5.25% | 1,031,666 | 986,178 | 0 | 111,835 |
Massachusetts Results for 2010
Login
© Dave Leip's Atlas of U.S. Elections, LLC 2019 All Rights Reserved
Note: The advertisement links below may advocate political positions that this site does not endorse.
Login
© Dave Leip's Atlas of U.S. Elections, LLC 2019 All Rights Reserved
Note: The advertisement links below may advocate political positions that this site does not endorse.