| Map | Pie | Office | Total | D | R | I | Margin | %Margin | Dem | Rep | Ind | Oth. | Dem | Rep | Ind | Other | | | | | | | | | | | | | | | | | | |
|---|
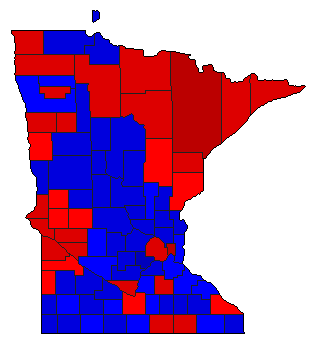
 |  | Governor |
2,107,021 |
1 |
2 |
3 |
8,770 |
0.42% |
43.63% |
43.21% |
11.94% |
1.23% |
919,232 |
910,462 |
251,487 |
25,840 |
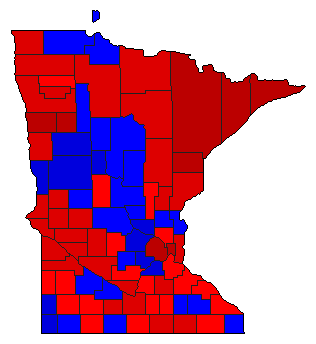
 | | Secretary of State |
2,035,404 |
1 |
2 |
3 |
70,461 |
3.46% |
49.10% |
45.64% |
5.19% |
0.07% |
999,396 |
928,935 |
105,678 |
1,395 |
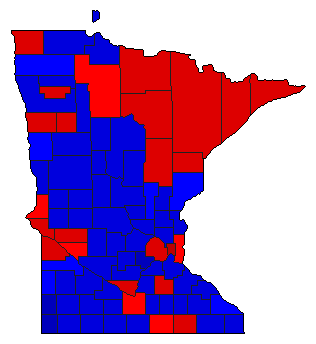
 | | Attorney General |
2,033,117 |
1 |
2 |
3 |
236,503 |
11.63% |
52.90% |
41.27% |
5.06% |
0.77% |
1,075,536 |
839,033 |
102,895 |
15,653 |
 | | State Auditor |
2,029,087 |
1 |
2 |
3 |
25,483 |
1.26% |
48.39% |
47.13% |
2.67% |
1.81% |
981,822 |
956,339 |
54,154 |
36,772 |
|
