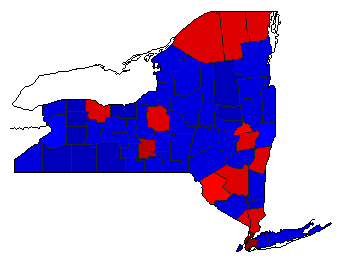
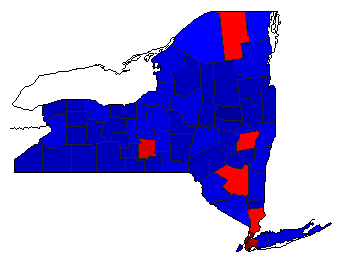
| Map | Pie | Office | Total | D | R | I | Margin | %Margin | Dem | Rep | Ind | Oth. | Dem | Rep | Ind | Other | | | | | | | | | | | | | | | | | | |
|---|
 |  | Senator |
4,595,375 |
1 |
2 |
0 |
1,567,387 |
34.11% |
66.31% |
32.20% |
0.00% |
1.49% |
3,047,111 |
1,479,724 |
0 |
68,540 |
 |  | Senator (S) |
4,506,626 |
1 |
2 |
0 |
1,254,527 |
27.84% |
62.94% |
35.10% |
0.00% |
1.96% |
2,836,361 |
1,581,834 |
0 |
88,431 |
 |  | Governor |
4,657,955 |
1 |
2 |
0 |
1,363,019 |
29.26% |
62.49% |
33.23% |
0.00% |
4.28% |
2,910,876 |
1,547,857 |
0 |
199,222 |
 | | Attorney General |
4,444,688 |
1 |
2 |
0 |
568,298 |
12.79% |
55.77% |
42.98% |
0.00% |
1.25% |
2,478,659 |
1,910,361 |
0 |
55,668 |
 | | Comptroller General |
4,476,455 |
1 |
2 |
0 |
202,456 |
4.52% |
50.77% |
46.25% |
0.00% |
2.98% |
2,272,805 |
2,070,349 |
0 |
133,301 |
|