| Map | Pie | Year | Total | D | R | I | Margin | %Margin | Dem | Rep | Ind | Oth. | Dem | Rep | Ind | Other | | | | | | | | | | | | | | | | | | |
|---|
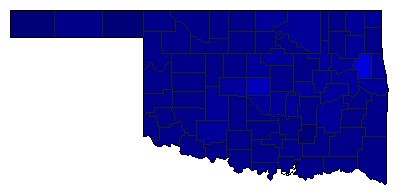 |  | 2018 |
1,089,164 |
0 |
1 |
0 |
548,538 |
50.36% |
0.00% |
75.18% |
0.00% |
24.82% |
0 |
818,851 |
0 |
270,313 |
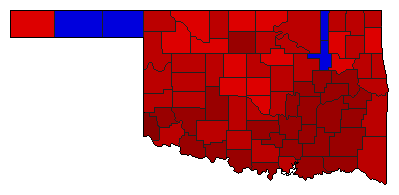
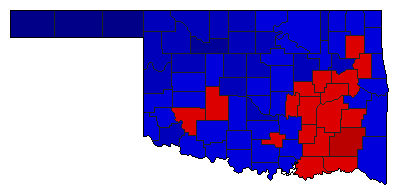 | | 2010 |
1,019,326 |
2 |
1 |
0 |
121,022 |
11.87% |
44.06% |
55.94% |
0.00% |
0.00% |
449,152 |
570,174 |
0 |
0 |
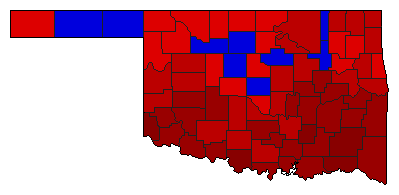
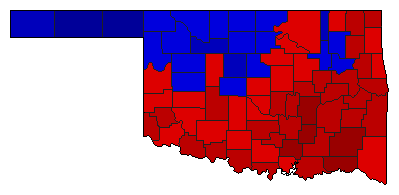 | | 2006 |
908,089 |
1 |
2 |
0 |
30,533 |
3.36% |
51.68% |
48.32% |
0.00% |
0.00% |
469,311 |
438,778 |
0 |
0 |
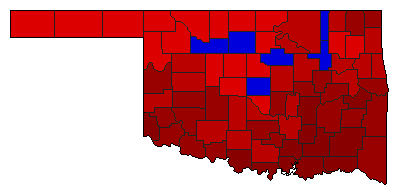
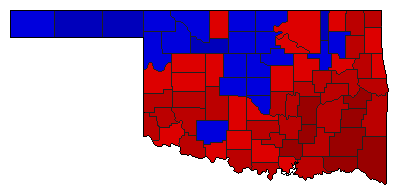 |  | 2002 |
1,004,071 |
1 |
2 |
0 |
28,779 |
2.87% |
51.43% |
48.57% |
0.00% |
0.00% |
516,425 |
487,646 |
0 |
0 |
 | | 1994 |
959,199 |
1 |
2 |
0 |
197,489 |
20.59% |
60.29% |
39.71% |
0.00% |
0.00% |
578,344 |
380,855 |
0 |
0 |
 | | 1986 |
855,733 |
1 |
2 |
0 |
129,369 |
15.12% |
57.56% |
42.44% |
0.00% |
0.00% |
492,551 |
363,182 |
0 |
0 |
 | | 1982 |
796,590 |
1 |
2 |
0 |
134,558 |
16.89% |
58.45% |
41.55% |
0.00% |
0.00% |
465,574 |
331,016 |
0 |
0 |
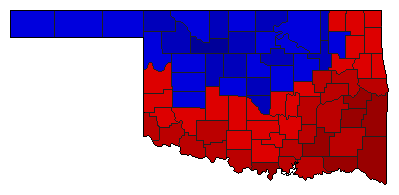 | | 1978 |
686,663 |
2 |
1 |
0 |
57,953 |
8.44% |
45.78% |
54.22% |
0.00% |
0.00% |
314,355 |
372,308 |
0 |
0 |
|
