| Map | Pie | Office | Total | D | R | I | Margin | %Margin | Dem | Rep | Ind | Oth. | Dem | Rep | Ind | Other | | | | | | | | | | | | | | | | | | |
|---|
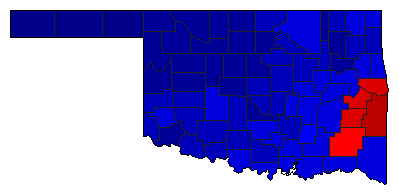
 |  | Senator |
1,017,151 |
2 |
1 |
3 |
452,668 |
44.50% |
26.13% |
70.64% |
2.46% |
0.77% |
265,814 |
718,482 |
25,048 |
7,807 |
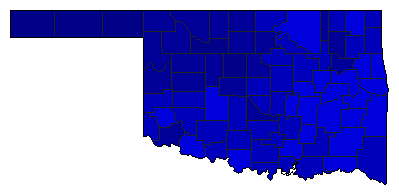
 |  | Governor |
1,034,767 |
2 |
1 |
0 |
216,245 |
20.90% |
39.55% |
60.45% |
0.00% |
0.00% |
409,261 |
625,506 |
0 |
0 |
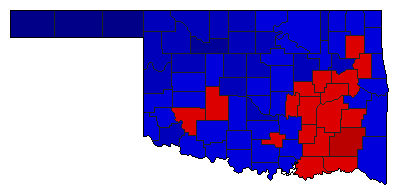
 | | Lt. Governor |
1,029,618 |
2 |
1 |
3 |
324,531 |
31.52% |
32.51% |
64.03% |
3.46% |
0.00% |
334,711 |
659,242 |
35,665 |
0 |
 | | State Treasurer |
1,014,787 |
2 |
1 |
0 |
336,243 |
33.13% |
33.43% |
66.57% |
0.00% |
0.00% |
339,272 |
675,515 |
0 |
0 |
 | | Attorney General |
1,023,569 |
2 |
1 |
0 |
309,245 |
30.21% |
34.89% |
65.11% |
0.00% |
0.00% |
357,162 |
666,407 |
0 |
0 |
 | | State Auditor |
1,019,326 |
2 |
1 |
0 |
121,022 |
11.87% |
44.06% |
55.94% |
0.00% |
0.00% |
449,152 |
570,174 |
0 |
0 |
 | | Insurance Commissioner |
1,020,050 |
2 |
1 |
0 |
91,430 |
8.96% |
45.52% |
54.48% |
0.00% |
0.00% |
464,310 |
555,740 |
0 |
0 |
| | | Map | Pie | Initiative | Total Vote | N | | Y | Margin | %Margin | No | | Yes | Oth. | No | | Yes | |
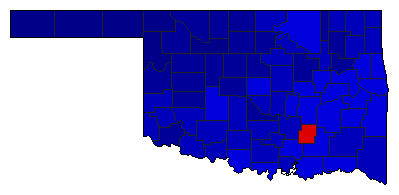
 | | Initiative |
992,844 |
2 |
0 |
1 |
396,614 |
39.95% |
30.03% |
0.00% |
69.97% |
0.00% |
298,115 |
0 |
694,729 |
0 |
|
