| Map | Pie | Year | Total | D | R | I | Margin | %Margin | Dem | Rep | Ind | Oth. | Dem | Rep | Ind | Other | | | | | | | | | | | | | | | | | | |
|---|
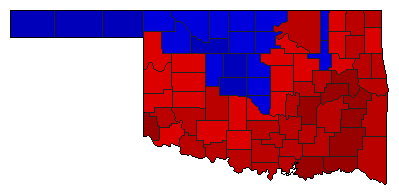
|  | 2022 |
1,074,389 |
0 |
1 |
0 |
510,543 |
47.52% |
0.00% |
73.76% |
0.00% |
26.24% |
0 |
792,466 |
0 |
281,923 |
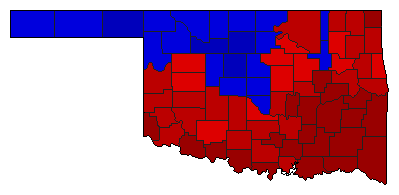
 |  | 2018 |
1,172,468 |
2 |
1 |
0 |
329,070 |
28.07% |
35.97% |
64.03% |
0.00% |
0.00% |
421,699 |
750,769 |
0 |
0 |
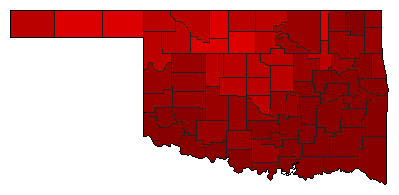
 | | 2010 |
1,023,569 |
2 |
1 |
0 |
309,245 |
30.21% |
34.89% |
65.11% |
0.00% |
0.00% |
357,162 |
666,407 |
0 |
0 |
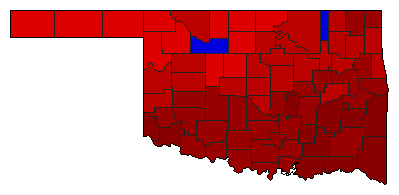
 | | 2006 |
920,631 |
1 |
2 |
0 |
206,097 |
22.39% |
61.19% |
38.81% |
0.00% |
0.00% |
563,364 |
357,267 |
0 |
0 |
 |  | 2002 |
1,024,765 |
1 |
2 |
0 |
207,099 |
20.21% |
60.10% |
39.90% |
0.00% |
0.00% |
615,932 |
408,833 |
0 |
0 |
 | | 1994 |
972,070 |
1 |
2 |
0 |
42,008 |
4.32% |
52.16% |
47.84% |
0.00% |
0.00% |
507,039 |
465,031 |
0 |
0 |
 | | 1986 |
879,821 |
1 |
2 |
0 |
80,533 |
9.15% |
54.58% |
45.42% |
0.00% |
0.00% |
480,177 |
399,644 |
0 |
0 |
 | | 1982 |
815,357 |
1 |
2 |
0 |
358,139 |
43.92% |
71.96% |
28.04% |
0.00% |
0.00% |
586,748 |
228,609 |
0 |
0 |
 | | 1978 |
691,232 |
1 |
2 |
0 |
223,876 |
32.39% |
66.19% |
33.81% |
0.00% |
0.00% |
457,554 |
233,678 |
0 |
0 |
|
