2010 General Election Results Comparison - South Carolina
| Map | Pie | Office | Total | D | R | I | Margin | %Margin | Dem | Rep | Ind | Oth. | Dem | Rep | Ind | Other |
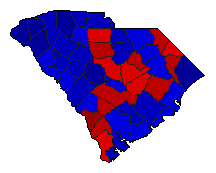
 |  | Senator | 1,318,794 | 2 | 1 | 0 | 446,173 | 33.83% | 27.65% | 61.48% | 0.00% | 10.88% | 364,598 | 810,771 | 0 | 143,425 |
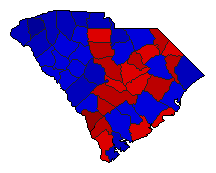
 |  | Governor | 1,344,198 | 2 | 1 | 0 | 59,991 | 4.46% | 46.91% | 51.37% | 0.00% | 1.72% | 630,534 | 690,525 | 0 | 23,139 |
 | Lt. Governor | 1,332,721 | 2 | 1 | 0 | 138,469 | 10.39% | 44.77% | 55.16% | 0.00% | 0.08% | 596,620 | 735,089 | 0 | 1,012 | |
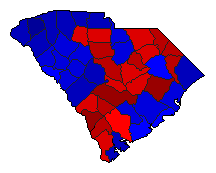
 | Secretary of State | 1,322,835 | 2 | 1 | 0 | 289,369 | 21.87% | 39.04% | 60.91% | 0.00% | 0.05% | 516,414 | 805,783 | 0 | 638 | |
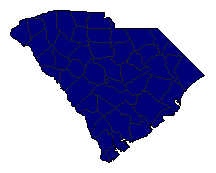 | State Treasurer | 917,503 | 0 | 1 | 0 | 898,007 | 97.88% | 0.00% | 98.94% | 0.00% | 1.06% | 0 | 907,755 | 0 | 9,748 | |
 | Attorney General | 1,332,806 | 2 | 1 | 0 | 127,058 | 9.53% | 44.20% | 53.74% | 0.00% | 2.06% | 589,135 | 716,193 | 0 | 27,478 | |
 | Comptroller General | 1,321,862 | 2 | 1 | 0 | 172,539 | 13.05% | 43.45% | 56.50% | 0.00% | 0.05% | 574,302 | 746,841 | 0 | 719 | |
 |  | Agriculture Commissioner | 1,318,022 | 2 | 1 | 0 | 267,031 | 20.26% | 39.85% | 60.11% | 0.00% | 0.04% | 525,229 | 792,260 | 0 | 533 |
South Carolina Results for 2010
Login
© Dave Leip's Atlas of U.S. Elections, LLC 2019 All Rights Reserved
Note: The advertisement links below may advocate political positions that this site does not endorse.
Login
© Dave Leip's Atlas of U.S. Elections, LLC 2019 All Rights Reserved
Note: The advertisement links below may advocate political positions that this site does not endorse.