| Map | Pie | Office | Total | D | R | I | Margin | %Margin | Dem | Rep | Ind | Oth. | Dem | Rep | Ind | Other | | | | | | | | | | | | | | | | | | |
|---|
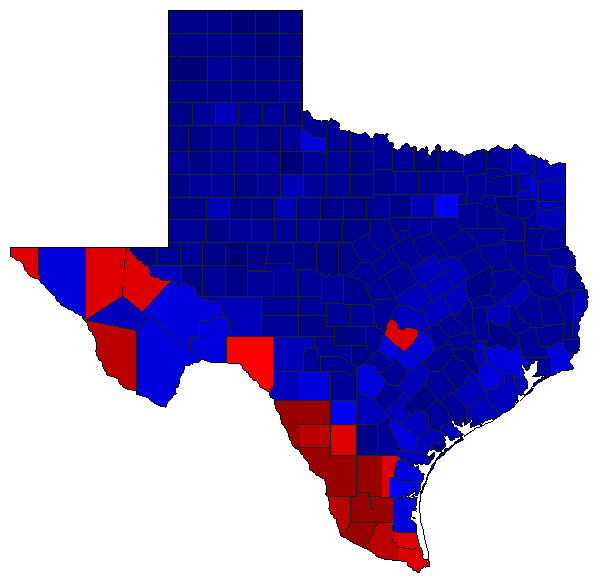
 |  | Governor |
4,979,870 |
2 |
1 |
0 |
631,086 |
12.67% |
42.30% |
54.97% |
0.00% |
2.73% |
2,106,395 |
2,737,481 |
0 |
135,994 |
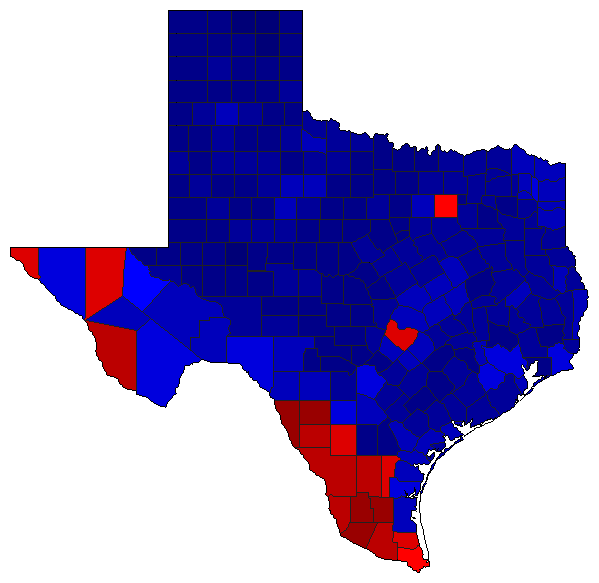
 | | Lt. Governor |
4,935,356 |
2 |
1 |
0 |
1,329,907 |
26.95% |
34.83% |
61.78% |
0.00% |
3.38% |
1,719,202 |
3,049,109 |
0 |
167,045 |
 | | Attorney General |
4,932,361 |
2 |
1 |
0 |
1,508,525 |
30.58% |
33.57% |
64.16% |
0.00% |
2.27% |
1,655,859 |
3,164,384 |
0 |
112,118 |
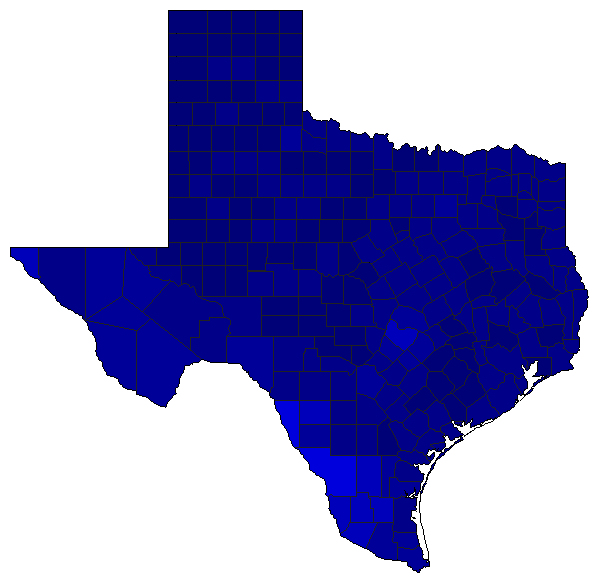 | | Comptroller General |
3,977,691 |
0 |
1 |
0 |
2,890,412 |
72.67% |
0.00% |
83.16% |
0.00% |
16.84% |
0 |
3,307,935 |
0 |
669,756 |
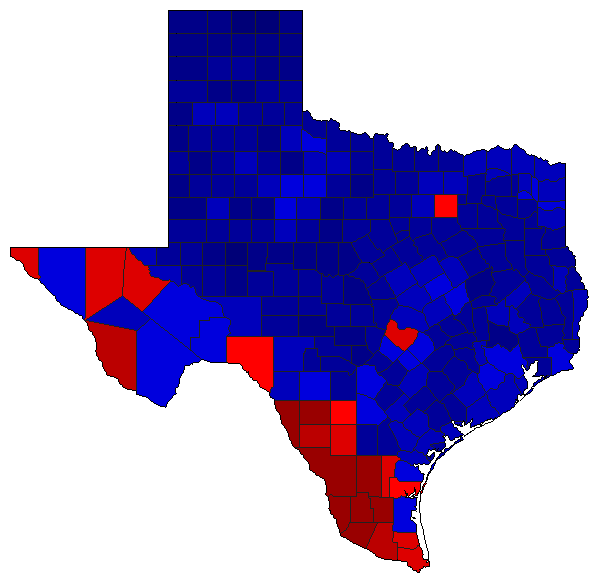 | | Agriculture Commissioner |
4,856,266 |
2 |
1 |
0 |
1,215,319 |
25.03% |
35.80% |
60.82% |
0.00% |
3.38% |
1,738,456 |
2,953,775 |
0 |
164,035 |
|
