2010 General Election Results Comparison - Vermont
| Map | Pie | Office | Total | D | R | I | Margin | %Margin | Dem | Rep | Ind | Oth. | Dem | Rep | Ind | Other |
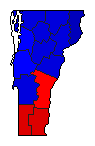
 |  | Senator | 235,178 | 1 | 2 | 3 | 78,582 | 33.41% | 64.33% | 30.91% | 1.51% | 3.25% | 151,281 | 72,699 | 3,544 | 7,654 |
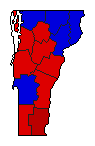
 |  | Governor | 241,605 | 1 | 2 | 5 | 4,331 | 1.79% | 49.48% | 47.69% | 0.56% | 2.28% | 119,543 | 115,212 | 1,341 | 5,509 |
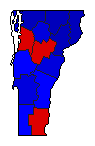
 | Lt. Governor | 235,330 | 2 | 1 | 0 | 16,355 | 6.95% | 42.43% | 49.38% | 0.00% | 8.20% | 99,843 | 116,198 | 0 | 19,289 | |
 | Secretary of State | 229,280 | 1 | 2 | 0 | 21,455 | 9.36% | 53.47% | 44.11% | 0.00% | 2.41% | 122,599 | 101,144 | 0 | 5,537 | |
 | State Treasurer | 226,704 | 1 | 0 | 0 | 186,716 | 82.36% | 90.01% | 0.00% | 0.00% | 9.99% | 204,048 | 0 | 0 | 22,656 | |
 | Attorney General | 230,973 | 1 | 2 | 0 | 75,131 | 32.53% | 61.93% | 29.40% | 0.00% | 8.68% | 143,031 | 67,900 | 0 | 20,042 | |
 | State Auditor | 231,221 | 2 | 1 | 0 | 15,156 | 6.55% | 45.45% | 52.00% | 0.00% | 2.55% | 105,081 | 120,237 | 0 | 5,903 |
Vermont Results for 2010
Login
© Dave Leip's Atlas of U.S. Elections, LLC 2019 All Rights Reserved
Note: The advertisement links below may advocate political positions that this site does not endorse.
Login
© Dave Leip's Atlas of U.S. Elections, LLC 2019 All Rights Reserved
Note: The advertisement links below may advocate political positions that this site does not endorse.