| Map | Pie | Office | Total | D | R | I | Margin | %Margin | Dem | Rep | Ind | Oth. | Dem | Rep | Ind | Other | | | | | | | | | | | | | | | | | | |
|---|
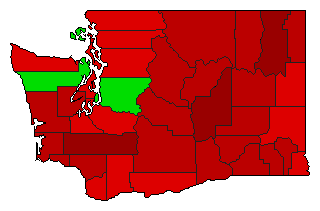
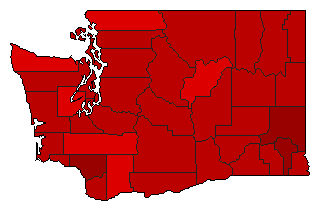
 |  | Senator |
2,511,094 |
1 |
2 |
0 |
118,766 |
4.73% |
52.36% |
47.64% |
0.00% |
0.00% |
1,314,930 |
1,196,164 |
0 |
0 |
| | | Map | Pie | Initiative | Total Vote | N | | Y | Margin | %Margin | No | | Yes | Oth. | No | | Yes | |
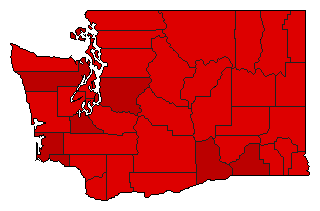
 | | Referendum |
2,464,780 |
1 |
0 |
2 |
185,726 |
7.54% |
53.77% |
0.00% |
46.23% |
0.00% |
1,325,253 |
0 |
1,139,527 |
0 |
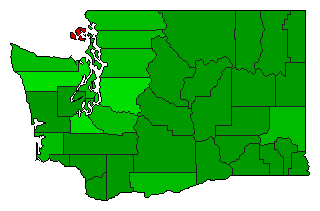
 | | Referendum |
2,269,652 |
2 |
0 |
1 |
91,452 |
4.03% |
47.99% |
0.00% |
52.01% |
0.00% |
1,089,100 |
0 |
1,180,552 |
0 |
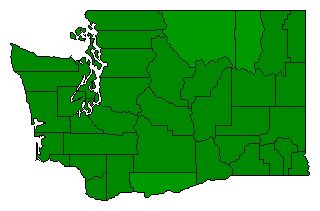 | | Referendum |
2,461,099 |
2 |
0 |
1 |
1,703,831 |
69.23% |
15.38% |
0.00% |
84.62% |
0.00% |
378,634 |
0 |
2,082,465 |
0 |
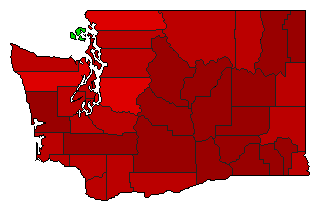 | | Initiative |
2,519,592 |
1 |
0 |
2 |
712,954 |
28.30% |
64.15% |
0.00% |
35.85% |
0.00% |
1,616,273 |
0 |
903,319 |
0 |
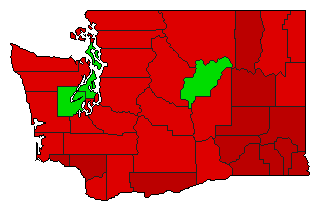 | | Initiative |
2,351,737 |
1 |
0 |
2 |
157,967 |
6.72% |
53.36% |
0.00% |
46.64% |
0.00% |
1,254,852 |
0 |
1,096,885 |
0 |
 | | Initiative |
2,513,203 |
1 |
0 |
2 |
755,829 |
30.07% |
65.04% |
0.00% |
34.96% |
0.00% |
1,634,516 |
0 |
878,687 |
0 |
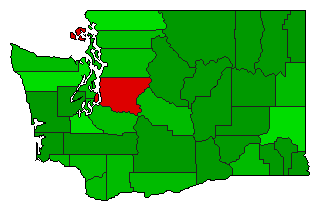
 | | Initiative |
2,471,488 |
2 |
0 |
1 |
679,822 |
27.51% |
36.25% |
0.00% |
63.75% |
0.00% |
895,833 |
0 |
1,575,655 |
0 |
 | | Initiative |
2,422,669 |
1 |
0 |
2 |
440,363 |
18.18% |
59.09% |
0.00% |
40.91% |
0.00% |
1,431,516 |
0 |
991,153 |
0 |
 | | Initiative |
2,519,419 |
2 |
0 |
1 |
525,897 |
20.87% |
39.56% |
0.00% |
60.44% |
0.00% |
996,761 |
0 |
1,522,658 |
0 |
|
