| Map | Pie | Office | Total | D | R | I | Margin | %Margin | Dem | Rep | Ind | Oth. | Dem | Rep | Ind | Other | | | | | | | | | | | | | | | | | | |
|---|
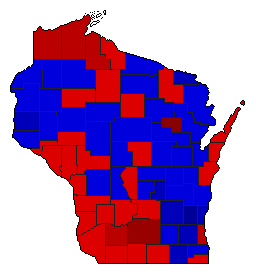
 |  | Senator |
2,171,331 |
2 |
1 |
0 |
105,041 |
4.84% |
47.02% |
51.86% |
0.00% |
1.12% |
1,020,958 |
1,125,999 |
0 |
24,374 |
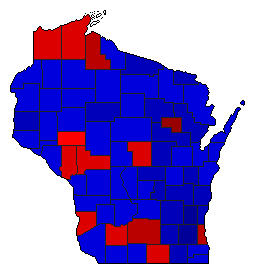
 |  | Governor |
2,160,832 |
2 |
1 |
3 |
124,638 |
5.77% |
46.48% |
52.25% |
0.49% |
0.79% |
1,004,303 |
1,128,941 |
10,608 |
16,980 |
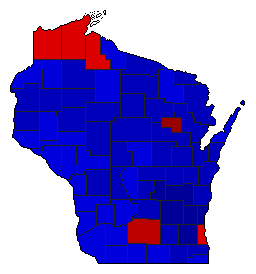
 | | Secretary of State |
2,081,198 |
1 |
2 |
0 |
68,901 |
3.31% |
51.61% |
48.30% |
0.00% |
0.09% |
1,074,118 |
1,005,217 |
0 |
1,863 |
 | | State Treasurer |
2,062,661 |
2 |
1 |
0 |
142,852 |
6.93% |
46.47% |
53.39% |
0.00% |
0.14% |
958,468 |
1,101,320 |
0 |
2,873 |
 | | Attorney General |
2,112,485 |
2 |
1 |
0 |
330,711 |
15.66% |
42.13% |
57.79% |
0.00% |
0.08% |
890,080 |
1,220,791 |
0 |
1,614 |
|
