| Map | Pie | Year | Total | D | R | I | Margin | %Margin | Dem | Rep | Ind | Oth. | Dem | Rep | Ind | Other | | | | | | | | | | | | | | | | | | |
|---|
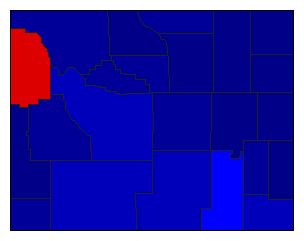 |  | 2018 |
199,098 |
2 |
1 |
0 |
83,671 |
42.03% |
26.80% |
68.82% |
0.00% |
4.38% |
53,355 |
137,026 |
0 |
8,717 |
 | | 2014 |
156,407 |
0 |
1 |
0 |
100,854 |
64.48% |
0.00% |
76.58% |
0.00% |
23.42% |
0 |
119,772 |
0 |
36,635 |
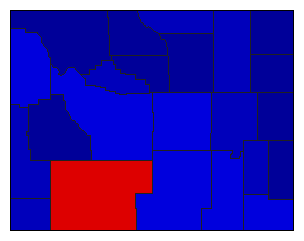
 | | 2010 |
184,156 |
2 |
1 |
0 |
104,214 |
56.59% |
19.48% |
76.07% |
0.00% |
4.45% |
35,873 |
140,087 |
0 |
8,196 |
 | | 2006 |
181,359 |
0 |
1 |
0 |
115,659 |
63.77% |
0.00% |
81.72% |
0.00% |
18.28% |
0 |
148,210 |
0 |
33,149 |
 | | 2002 |
169,472 |
0 |
1 |
0 |
109,970 |
64.89% |
0.00% |
82.44% |
0.00% |
17.56% |
0 |
139,721 |
0 |
29,751 |
 | | 1998 |
169,656 |
2 |
1 |
0 |
34,634 |
20.41% |
39.79% |
60.21% |
0.00% |
0.00% |
67,511 |
102,145 |
0 |
0 |
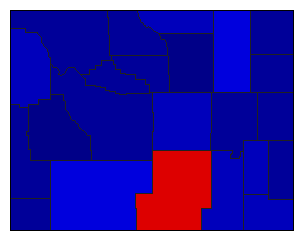 |  | 1994 |
194,343 |
2 |
1 |
0 |
63,795 |
32.83% |
33.59% |
66.41% |
0.00% |
0.00% |
65,274 |
129,069 |
0 |
0 |
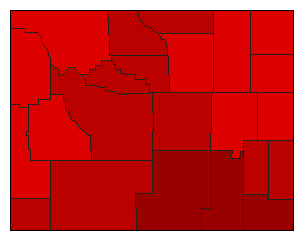 |  | 1990 |
156,677 |
1 |
2 |
0 |
44,781 |
28.58% |
64.29% |
35.71% |
0.00% |
0.00% |
100,729 |
55,948 |
0 |
0 |
 |  | 1986 |
161,329 |
1 |
2 |
0 |
11,569 |
7.17% |
53.59% |
46.41% |
0.00% |
0.00% |
86,449 |
74,880 |
0 |
0 |
 |  | 1982 |
165,367 |
2 |
1 |
0 |
12,249 |
7.41% |
46.30% |
53.70% |
0.00% |
0.00% |
76,559 |
88,808 |
0 |
0 |
 |  | 1978 |
103,102 |
0 |
1 |
0 |
103,102 |
100.00% |
0.00% |
100.00% |
0.00% |
0.00% |
0 |
103,102 |
0 |
0 |
 |  | 1974 |
124,713 |
2 |
1 |
0 |
30,517 |
24.47% |
37.77% |
62.23% |
0.00% |
0.00% |
47,098 |
77,615 |
0 |
0 |
|
