2010 General Election Results Comparison - California
| Map | Pie | Office | Total | D | R | I | Margin | %Margin | Dem | Rep | Ind | Oth. | Dem | Rep | Ind | Other |
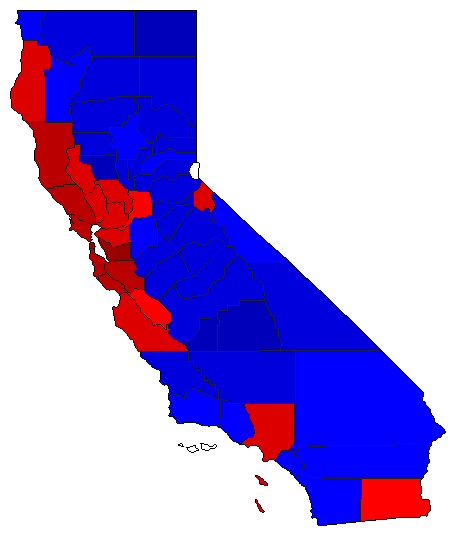
 |  | Senator | 10,000,160 | 1 | 2 | 0 | 1,001,075 | 10.01% | 52.18% | 42.17% | 0.00% | 5.64% | 5,218,441 | 4,217,366 | 0 | 564,353 |
 |  | Governor | 10,095,485 | 1 | 2 | 0 | 1,301,087 | 12.89% | 53.77% | 40.88% | 0.00% | 5.35% | 5,428,458 | 4,127,371 | 0 | 539,656 |
 | Lt. Governor | 9,813,130 | 1 | 2 | 0 | 1,097,181 | 11.18% | 50.12% | 38.94% | 0.00% | 10.94% | 4,918,158 | 3,820,977 | 0 | 1,073,995 | |
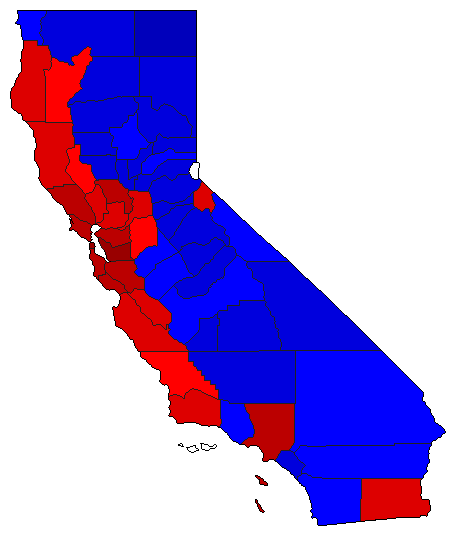 | Secretary of State | 9,599,217 | 1 | 2 | 0 | 1,438,900 | 14.99% | 53.18% | 38.19% | 0.00% | 8.62% | 5,105,307 | 3,666,407 | 0 | 827,503 | |
 | State Treasurer | 9,623,972 | 1 | 2 | 0 | 1,953,513 | 20.30% | 56.46% | 36.16% | 0.00% | 7.39% | 5,433,222 | 3,479,709 | 0 | 711,041 | |
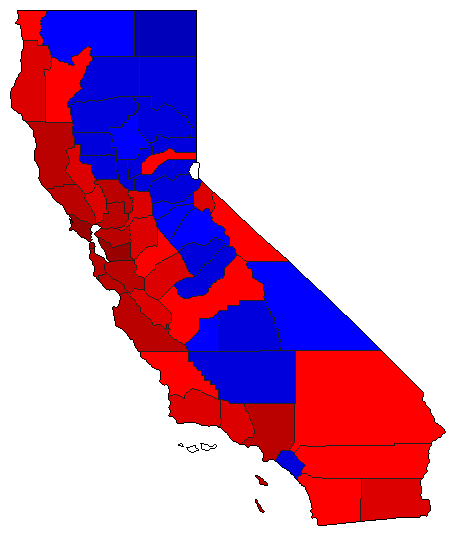
 | Attorney General | 8,931,183 | 1 | 2 | 0 | 13,796 | 0.15% | 45.85% | 45.70% | 0.00% | 8.45% | 4,095,203 | 4,081,407 | 0 | 754,573 | |
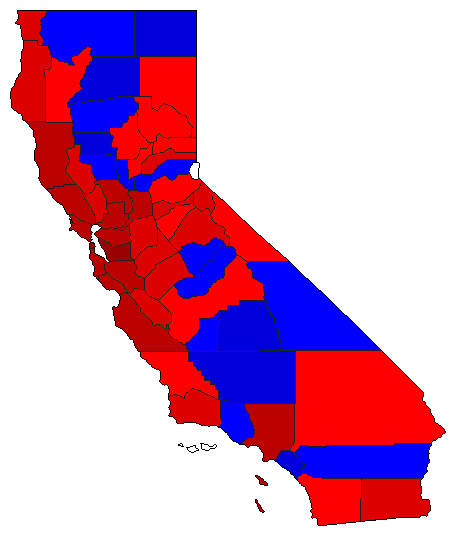 | Controller | 9,659,877 | 1 | 2 | 0 | 1,838,343 | 19.03% | 55.13% | 36.10% | 0.00% | 8.77% | 5,325,357 | 3,487,014 | 0 | 847,506 | |
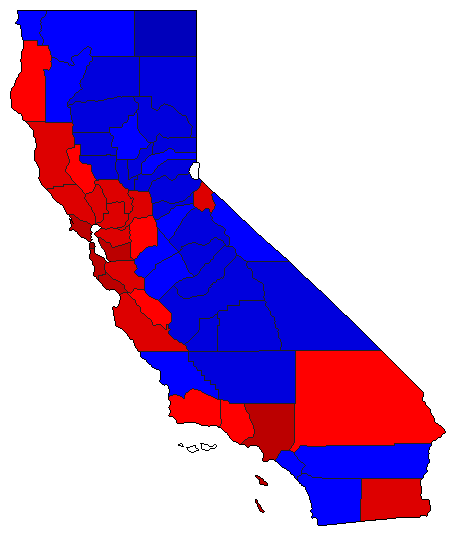 | Insurance Commissioner | 9,422,852 | 1 | 2 | 0 | 1,224,774 | 13.00% | 50.57% | 37.57% | 0.00% | 11.85% | 4,765,400 | 3,540,626 | 0 | 1,116,826 | |
| Map | Pie | Initiative | Total Vote | N | Y | Margin | %Margin | No | Yes | Oth. | No | Yes | ||||
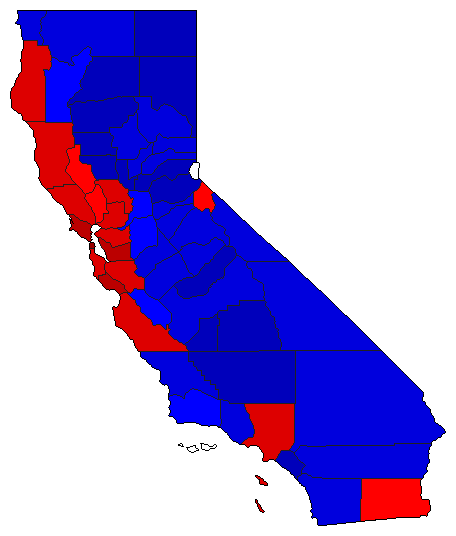
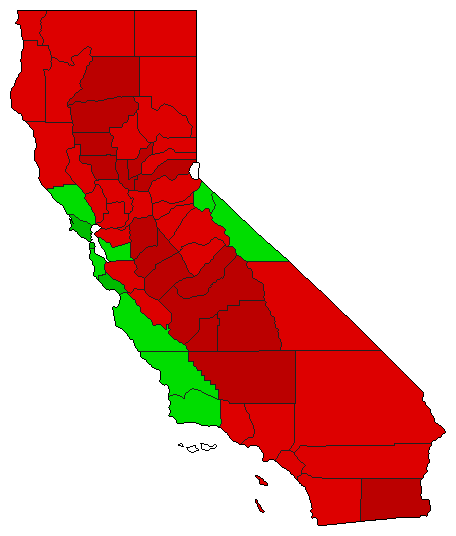 | Initiative | 7,390,701 | 1 | 0 | 2 | 565,927 | 7.66% | 53.83% | 0.00% | 46.17% | 0.00% | 3,978,314 | 0 | 3,412,387 | 0 | |
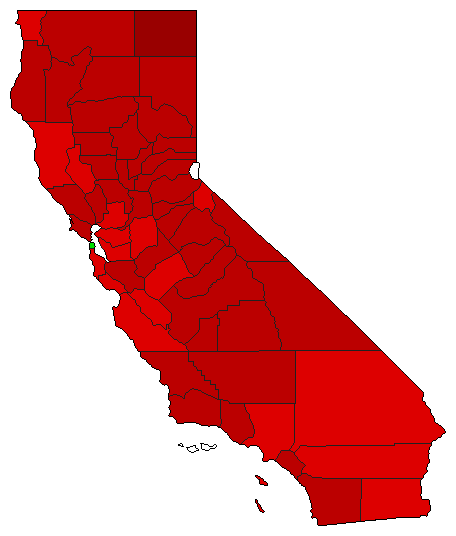 | Initiative | 8,278,065 | 1 | 0 | 2 | 1,592,645 | 19.24% | 59.62% | 0.00% | 40.38% | 0.00% | 4,935,355 | 0 | 3,342,710 | 0 | |
 | Initiative | 8,430,874 | 2 | 0 | 1 | 1,923,130 | 22.81% | 38.59% | 0.00% | 61.41% | 0.00% | 3,253,872 | 0 | 5,177,002 | 0 | |
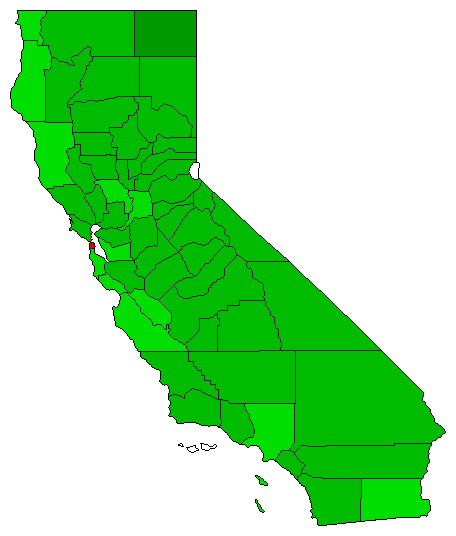
California Results for 2010
Login
© Dave Leip's Atlas of U.S. Elections, LLC 2019 All Rights Reserved
Note: The advertisement links below may advocate political positions that this site does not endorse.
Login
© Dave Leip's Atlas of U.S. Elections, LLC 2019 All Rights Reserved
Note: The advertisement links below may advocate political positions that this site does not endorse.