Note: The Google advertisement links below may advocate political positions that this site does not endorse.
| Map | Pie | Office | Total | D | R | I | Margin | %Margin | Dem | Rep | Ind | Oth. | Dem | Rep | Ind | Other | | | | | | | | | | | | | | | | | | |
|---|
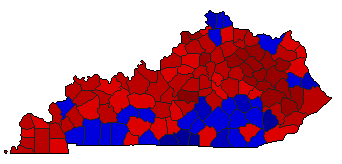
 |  | Governor |
833,139 |
1 |
2 |
3 |
170,211 |
20.43% |
55.72% |
35.29% |
8.99% |
0.00% |
464,245 |
294,034 |
74,860 |
0 |
 | | Secretary of State |
815,433 |
1 |
2 |
0 |
173,303 |
21.25% |
60.63% |
39.37% |
0.00% |
0.00% |
494,368 |
321,065 |
0 |
0 |
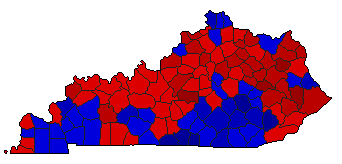
 | | State Treasurer |
806,590 |
1 |
2 |
0 |
17,497 |
2.17% |
48.77% |
46.61% |
0.00% |
4.62% |
393,413 |
375,916 |
0 |
37,261 |
 | | Attorney General |
817,240 |
1 |
2 |
0 |
81,986 |
10.03% |
55.02% |
44.98% |
0.00% |
0.00% |
449,613 |
367,627 |
0 |
0 |
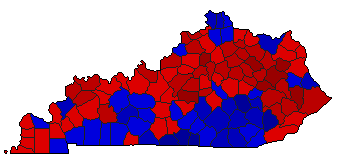 | | State Auditor |
789,786 |
1 |
2 |
0 |
90,979 |
11.52% |
55.75% |
44.24% |
0.00% |
0.01% |
440,345 |
349,366 |
0 |
75 |
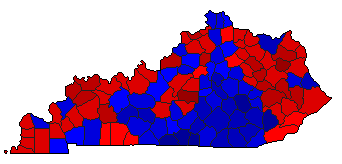
 | | Agriculture Commissioner |
813,846 |
2 |
1 |
0 |
224,520 |
27.59% |
36.21% |
63.79% |
0.00% |
0.00% |
294,663 |
519,183 |
0 |
0 |
|
