Note: The Google advertisement links below may advocate political positions that this site does not endorse.
| Map | Pie | Year | Total | D | R | I | Margin | %Margin | Dem | Rep | Ind | Oth. | Dem | Rep | Ind | Other | | | | | | | | | | | | | | | | | | |
|---|
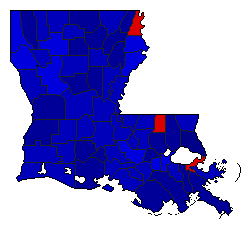 | | 2011 |
965,876 |
2 |
1 |
0 |
337,242 |
34.92% |
32.54% |
67.46% |
0.00% |
0.00% |
314,317 |
651,559 |
0 |
0 |
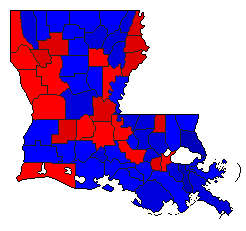 | | 2007 |
1,191,637 |
2 |
1 |
3 |
182,812 |
15.34% |
35.56% |
50.90% |
8.89% |
4.65% |
423,722 |
606,534 |
105,981 |
55,400 |
|
