Note: The Google advertisement links below may advocate political positions that this site does not endorse.
| Map | Pie | Office | Total | D | R | I | Margin | %Margin | Dem | Rep | Ind | Oth. | Dem | Rep | Ind | Other | | | | | | | | | | | | | | | | | | |
|---|
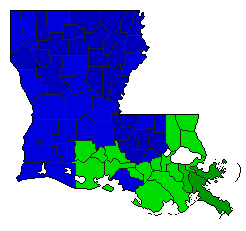
 |  | Governor |
1,023,163 |
2 |
1 |
5 |
490,314 |
47.92% |
17.88% |
65.80% |
2.61% |
13.71% |
182,925 |
673,239 |
26,705 |
140,294 |
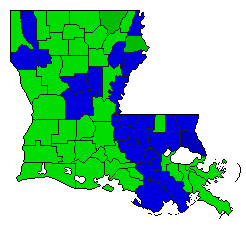
 | | Lt. Governor |
949,590 |
0 |
1 |
2 |
59,492 |
6.27% |
0.00% |
53.13% |
46.87% |
0.00% |
0 |
504,541 |
445,049 |
0 |
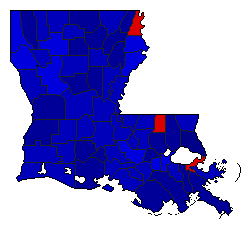
 | | Secretary of State |
890,786 |
0 |
1 |
2 |
8,446 |
0.95% |
0.00% |
50.47% |
49.53% |
0.00% |
0 |
449,616 |
441,170 |
0 |
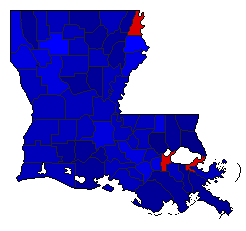
 | | Insurance Commissioner |
965,876 |
2 |
1 |
0 |
337,242 |
34.92% |
32.54% |
67.46% |
0.00% |
0.00% |
314,317 |
651,559 |
0 |
0 |
 |  | Agriculture Commissioner |
963,716 |
2 |
1 |
3 |
372,944 |
38.70% |
27.80% |
66.50% |
5.70% |
0.00% |
267,942 |
640,886 |
54,888 |
0 |
|
