Note: The Google advertisement links below may advocate political positions that this site does not endorse.
| Map | Pie | Year | Total | D | R | I | Margin | %Margin | Dem | Rep | Ind | Oth. | Dem | Rep | Ind | Other | | | | | | | | | | | | | | | | | | |
|---|
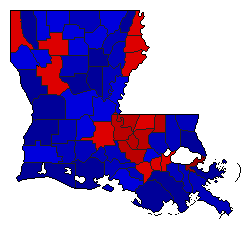
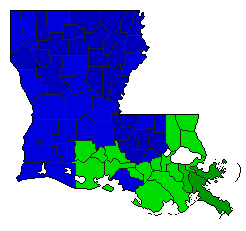
|  | 2023 |
1,035,594 |
2 |
1 |
5 |
466,543 |
45.05% |
20.47% |
65.52% |
1.66% |
12.35% |
211,988 |
678,531 |
17,195 |
127,880 |
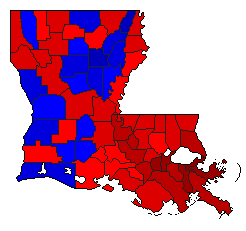
 |  | 2015 |
1,135,442 |
2 |
1 |
0 |
122,286 |
10.77% |
44.62% |
55.38% |
0.00% |
0.00% |
506,578 |
628,864 |
0 |
0 |
 | | 2011 |
949,590 |
0 |
1 |
2 |
59,492 |
6.27% |
0.00% |
53.13% |
46.87% |
0.00% |
0 |
504,541 |
445,049 |
0 |
 | | 2007 |
1,231,196 |
1 |
2 |
3 |
323,321 |
26.26% |
56.60% |
30.34% |
10.51% |
2.55% |
696,899 |
373,578 |
129,363 |
31,356 |
|
