2012 General Election Results Comparison - Louisiana
| Map | Pie | Office | Total | D | R | I | Margin | %Margin | Dem | Rep | Ind | Oth. | Dem | Rep | Ind | Other |
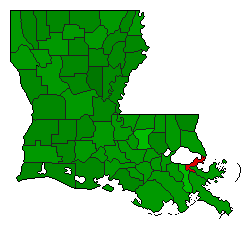
 |  | President | 1,994,065 | 2 | 1 | - | 343,121 | 17.21% | 40.58% | 57.78% | 0.00% | 1.64% | 809,141 | 1,152,262 | 0 | 32,662 |
| Map | Pie | Initiative | Total Vote | N | Y | Margin | %Margin | No | Yes | Oth. | No | Yes | ||||
 | Referendum | 1,813,251 | 2 | 0 | 1 | 850,531 | 46.91% | 26.55% | 0.00% | 73.45% | 0.00% | 481,360 | 0 | 1,331,891 | 0 | |
Louisiana Results for 2012
Login
© Dave Leip's Atlas of U.S. Elections, LLC 2019 All Rights Reserved
Note: The advertisement links below may advocate political positions that this site does not endorse.
Login
© Dave Leip's Atlas of U.S. Elections, LLC 2019 All Rights Reserved
Note: The advertisement links below may advocate political positions that this site does not endorse.