| Map | Pie | Office | Total | D | R | I | Margin | %Margin | Dem | Rep | Ind | Oth. | Dem | Rep | Ind | Other | | | | | | | | | | | | | | | | | | |
|---|
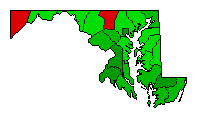
 |  | President |
2,707,327 |
1 |
2 |
- |
705,975 |
26.08% |
61.97% |
35.90% |
0.00% |
2.13% |
1,677,844 |
971,869 |
0 |
57,614 |
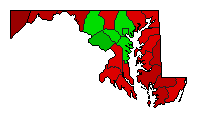
 |  | Senator |
2,633,234 |
1 |
2 |
3 |
780,737 |
29.65% |
55.98% |
26.33% |
16.37% |
1.33% |
1,474,028 |
693,291 |
430,934 |
34,981 |
| | | Map | Pie | Initiative | Total Vote | N | | Y | Margin | %Margin | No | | Yes | Oth. | No | | Yes | |
 |  | Referendum |
2,419,079 |
2 |
0 |
1 |
679,943 |
28.11% |
35.95% |
0.00% |
64.05% |
0.00% |
869,568 |
0 |
1,549,511 |
0 |
 | | Referendum |
2,452,970 |
2 |
0 |
1 |
93,866 |
3.83% |
48.09% |
0.00% |
51.91% |
0.00% |
1,179,552 |
0 |
1,273,418 |
0 |
|
