2012 General Election Results Comparison - Michigan
| Map | Pie | Office | Total | D | R | I | Margin | %Margin | Dem | Rep | Ind | Oth. | Dem | Rep | Ind | Other |
 |  | President | 4,745,316 | 1 | 2 | - | 449,313 | 9.47% | 54.04% | 44.58% | 0.00% | 1.38% | 2,564,569 | 2,115,256 | 0 | 65,491 |
 |  | Senator | 4,652,918 | 1 | 2 | 0 | 968,440 | 20.81% | 58.80% | 37.98% | 0.00% | 3.22% | 2,735,826 | 1,767,386 | 0 | 149,706 |
| Map | Pie | Initiative | Total Vote | N | Y | Margin | %Margin | No | Yes | Oth. | No | Yes | ||||
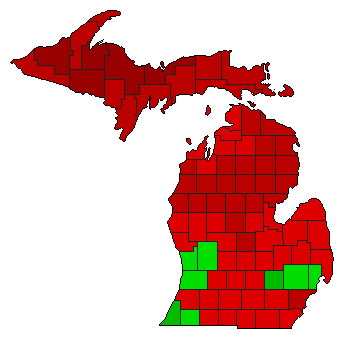 | Referendum | 4,500,955 | 1 | 0 | 2 | 240,247 | 5.34% | 52.67% | 0.00% | 47.33% | 0.00% | 2,370,601 | 0 | 2,130,354 | 0 | |
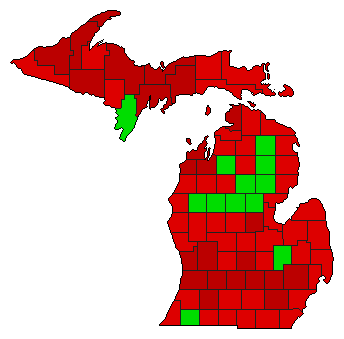 | Initiative | 4,552,685 | 1 | 0 | 2 | 846,431 | 18.59% | 59.30% | 0.00% | 40.70% | 0.00% | 2,699,558 | 0 | 1,853,127 | 0 | |
 | Initiative | 4,576,244 | 1 | 0 | 2 | 677,218 | 14.80% | 57.40% | 0.00% | 42.60% | 0.00% | 2,626,731 | 0 | 1,949,513 | 0 | |
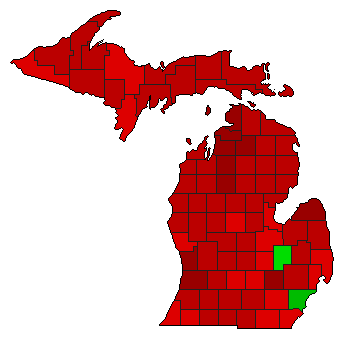
 | Initiative | 4,563,279 | 1 | 0 | 2 | 1,120,721 | 24.56% | 62.28% | 0.00% | 37.72% | 0.00% | 2,842,000 | 0 | 1,721,279 | 0 | |
 | Initiative | 4,536,015 | 1 | 0 | 2 | 564,825 | 12.45% | 56.23% | 0.00% | 43.77% | 0.00% | 2,550,420 | 0 | 1,985,595 | 0 | |
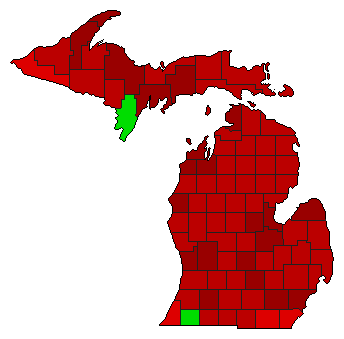 | Initiative | 4,516,593 | 1 | 0 | 2 | 1,694,705 | 37.52% | 68.76% | 0.00% | 31.24% | 0.00% | 3,105,649 | 0 | 1,410,944 | 0 | |
Michigan Results for 2012
Login
© Dave Leip's Atlas of U.S. Elections, LLC 2019 All Rights Reserved
Note: The advertisement links below may advocate political positions that this site does not endorse.
Login
© Dave Leip's Atlas of U.S. Elections, LLC 2019 All Rights Reserved
Note: The advertisement links below may advocate political positions that this site does not endorse.