| Map | Pie | Office | Total | D | R | I | Margin | %Margin | Dem | Rep | Ind | Oth. | Dem | Rep | Ind | Other | | | | | | | | | | | | | | | | | | |
|---|
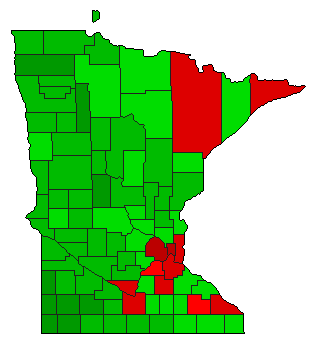
 |  | President |
2,936,561 |
1 |
2 |
- |
225,942 |
7.69% |
52.65% |
44.96% |
0.00% |
2.39% |
1,546,167 |
1,320,225 |
0 |
70,169 |
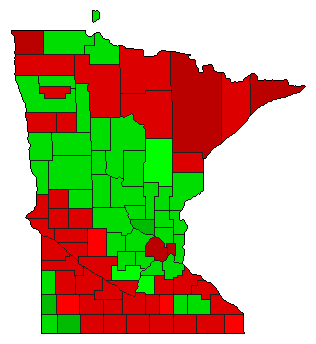
 |  | Senator |
2,843,207 |
1 |
2 |
3 |
986,621 |
34.70% |
65.23% |
30.53% |
2.59% |
1.66% |
1,854,595 |
867,974 |
73,539 |
47,099 |
| | | Map | Pie | Initiative | Total Vote | N | | Y | Margin | %Margin | No | | Yes | Oth. | No | | Yes | |
 | | Referendum |
2,950,439 |
1 |
0 |
2 |
110,691 |
3.75% |
51.19% |
0.00% |
47.44% |
1.37% |
1,510,366 |
0 |
1,399,675 |
40,398 |
 | | Referendum |
2,950,699 |
1 |
0 |
2 |
177,028 |
6.00% |
52.16% |
0.00% |
46.16% |
1.68% |
1,539,058 |
0 |
1,362,030 |
49,611 |
|
