| Map | Pie | Office | Total | D | R | I | Margin | %Margin | Dem | Rep | Ind | Oth. | Dem | Rep | Ind | Other | | | | | | | | | | | | | | | | | | |
|---|
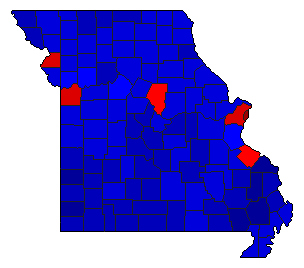
 |  | President |
2,763,689 |
2 |
1 |
- |
258,644 |
9.36% |
44.28% |
53.64% |
0.00% |
2.08% |
1,223,796 |
1,482,440 |
0 |
57,453 |
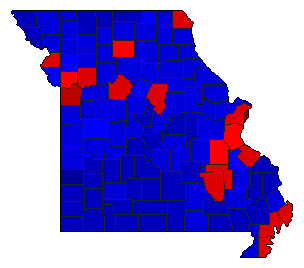
 |  | Senator |
2,725,793 |
1 |
2 |
0 |
427,966 |
15.70% |
54.81% |
39.11% |
0.00% |
6.07% |
1,494,125 |
1,066,159 |
0 |
165,509 |
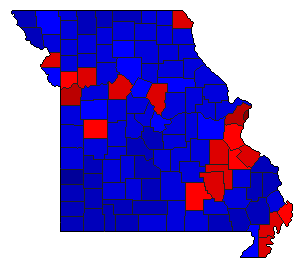
 |  | Governor |
2,727,883 |
1 |
2 |
0 |
333,791 |
12.24% |
54.77% |
42.53% |
0.00% |
2.70% |
1,494,056 |
1,160,265 |
0 |
73,562 |
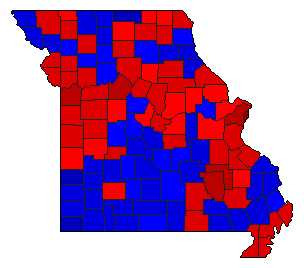
 | | Lt. Governor |
2,678,313 |
2 |
1 |
0 |
100,290 |
3.74% |
45.53% |
49.28% |
0.00% |
5.19% |
1,219,457 |
1,319,747 |
0 |
139,109 |
 | | Secretary of State |
2,655,483 |
1 |
2 |
0 |
39,085 |
1.47% |
48.88% |
47.41% |
0.00% |
3.71% |
1,298,022 |
1,258,937 |
0 |
98,524 |
 | | State Treasurer |
2,642,432 |
1 |
2 |
0 |
132,508 |
5.01% |
50.44% |
45.43% |
0.00% |
4.13% |
1,332,876 |
1,200,368 |
0 |
109,188 |
 | | Attorney General |
2,668,064 |
1 |
2 |
0 |
407,033 |
15.26% |
55.89% |
40.63% |
0.00% |
3.48% |
1,491,139 |
1,084,106 |
0 |
92,819 |
|