| Map | Pie | Office | Total | D | R | I | Margin | %Margin | Dem | Rep | Ind | Oth. | Dem | Rep | Ind | Other | | | | | | | | | | | | | | | | | | |
|---|
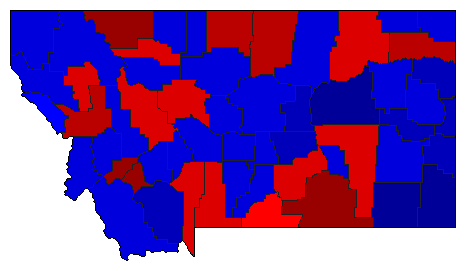
 |  | President |
484,484 |
2 |
1 |
- |
66,089 |
13.64% |
41.66% |
55.30% |
0.00% |
3.04% |
201,839 |
267,928 |
0 |
14,717 |
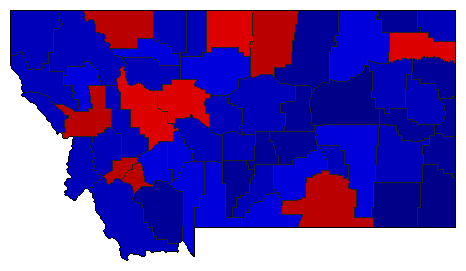
 |  | Senator |
486,066 |
1 |
2 |
0 |
18,072 |
3.72% |
48.58% |
44.86% |
0.00% |
6.56% |
236,123 |
218,051 |
0 |
31,892 |
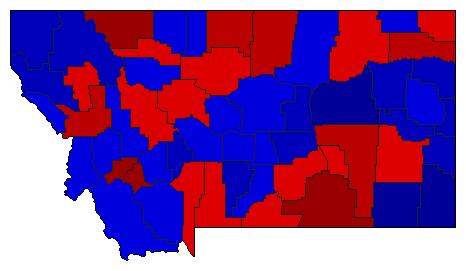
 |  | US Representative |
479,740 |
2 |
1 |
0 |
50,529 |
10.53% |
42.72% |
53.25% |
0.00% |
4.03% |
204,939 |
255,468 |
0 |
19,333 |
 |  | Governor |
483,489 |
1 |
2 |
0 |
7,571 |
1.57% |
48.90% |
47.34% |
0.00% |
3.76% |
236,450 |
228,879 |
0 |
18,160 |
 | | Secretary of State |
471,984 |
1 |
2 |
0 |
28,807 |
6.10% |
51.32% |
45.22% |
0.00% |
3.46% |
242,236 |
213,429 |
0 |
16,319 |
 | | Attorney General |
466,485 |
2 |
1 |
0 |
35,667 |
7.65% |
46.18% |
53.82% |
0.00% |
0.00% |
215,409 |
251,076 |
0 |
0 |
 | | State Auditor |
459,814 |
1 |
2 |
0 |
31,792 |
6.91% |
53.46% |
46.54% |
0.00% |
0.00% |
245,803 |
214,011 |
0 |
0 |
| | | Map | Pie | Initiative | Total Vote | N | | Y | Margin | %Margin | No | | Yes | Oth. | No | | Yes | |
 |  | Referendum |
474,014 |
2 |
0 |
1 |
194,818 |
41.10% |
29.45% |
0.00% |
70.55% |
0.00% |
139,598 |
0 |
334,416 |
0 |
 |  | Referendum |
476,091 |
2 |
0 |
1 |
281,035 |
59.03% |
20.49% |
0.00% |
79.51% |
0.00% |
97,528 |
0 |
378,563 |
0 |
 |  | Referendum |
474,148 |
2 |
0 |
1 |
163,076 |
34.39% |
32.80% |
0.00% |
67.20% |
0.00% |
155,536 |
0 |
318,612 |
0 |
 |  | Referendum |
469,520 |
2 |
0 |
1 |
68,060 |
14.50% |
42.75% |
0.00% |
57.25% |
0.00% |
200,730 |
0 |
268,790 |
0 |
 | | Initiative |
455,459 |
2 |
0 |
1 |
224,887 |
49.38% |
25.31% |
0.00% |
74.69% |
0.00% |
115,286 |
0 |
340,173 |
0 |
|
