| Map | Pie | Office | Total | D | R | I | Margin | %Margin | Dem | Rep | Ind | Oth. | Dem | Rep | Ind | Other | | | | | | | | | | | | | | | | | | |
|---|
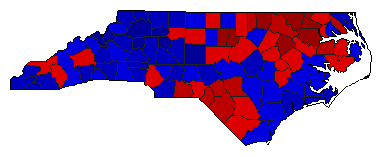
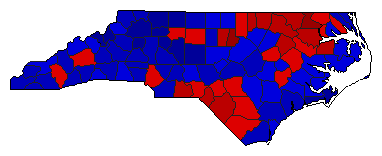
 |  | President |
4,505,372 |
2 |
1 |
- |
92,004 |
2.04% |
48.35% |
50.39% |
0.00% |
1.26% |
2,178,391 |
2,270,395 |
0 |
56,586 |
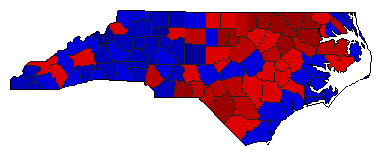
 |  | Governor |
4,468,295 |
2 |
1 |
0 |
509,127 |
11.39% |
43.23% |
54.62% |
0.00% |
2.15% |
1,931,580 |
2,440,707 |
0 |
96,008 |
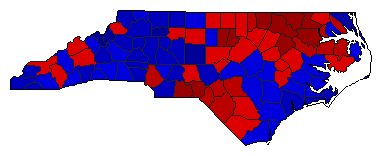
 | | Lt. Governor |
4,369,251 |
2 |
1 |
0 |
6,307 |
0.14% |
49.93% |
50.07% |
0.00% |
0.00% |
2,181,472 |
2,187,779 |
0 |
0 |
 | | Secretary of State |
4,334,853 |
1 |
2 |
0 |
328,691 |
7.58% |
53.79% |
46.21% |
0.00% |
0.00% |
2,331,772 |
2,003,081 |
0 |
0 |
 | | State Treasurer |
4,299,358 |
1 |
2 |
0 |
329,560 |
7.67% |
53.83% |
46.17% |
0.00% |
0.00% |
2,314,459 |
1,984,899 |
0 |
0 |
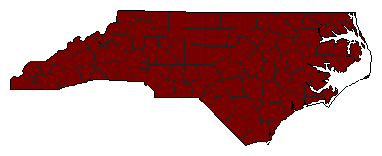 | | Attorney General |
2,828,941 |
1 |
0 |
0 |
2,828,941 |
100.00% |
100.00% |
0.00% |
0.00% |
0.00% |
2,828,941 |
0 |
0 |
0 |
 | | State Auditor |
4,281,719 |
1 |
2 |
0 |
318,515 |
7.44% |
53.72% |
46.28% |
0.00% |
0.00% |
2,300,117 |
1,981,602 |
0 |
0 |
 | | Insurance Commissioner |
4,292,945 |
1 |
2 |
0 |
159,743 |
3.72% |
51.86% |
48.14% |
0.00% |
0.00% |
2,226,344 |
2,066,601 |
0 |
0 |
 | | Agriculture Commissioner |
4,328,640 |
2 |
1 |
0 |
278,532 |
6.43% |
46.78% |
53.22% |
0.00% |
0.00% |
2,025,054 |
2,303,586 |
0 |
0 |
|
