2012 General Election Results Comparison - North Dakota
| Map | Pie | Office | Total | D | R | I | Margin | %Margin | Dem | Rep | Ind | Oth. | Dem | Rep | Ind | Other |
 |  | President | 322,627 | 2 | 1 | - | 63,336 | 19.63% | 38.69% | 58.32% | 0.00% | 2.99% | 124,827 | 188,163 | 0 | 9,637 |
 |  | Senator | 320,851 | 1 | 2 | 0 | 2,881 | 0.90% | 50.23% | 49.33% | 0.00% | 0.44% | 161,163 | 158,282 | 0 | 1,406 |
 |  | US Representative | 316,071 | 2 | 1 | 0 | 41,564 | 13.15% | 41.72% | 54.87% | 0.00% | 3.41% | 131,869 | 173,433 | 0 | 10,769 |
 |  | Governor | 317,812 | 2 | 1 | 3 | 91,479 | 28.78% | 34.31% | 63.10% | 1.69% | 0.91% | 109,047 | 200,526 | 5,356 | 2,883 |
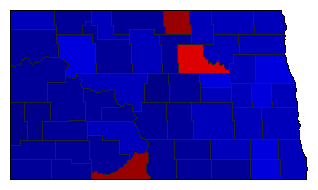 | State Treasurer | 299,306 | 2 | 1 | 0 | 95,246 | 31.82% | 34.01% | 65.83% | 0.00% | 0.16% | 101,795 | 197,041 | 0 | 470 | |
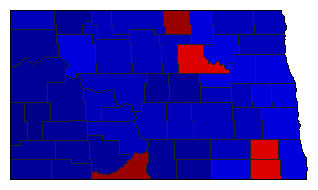 | State Auditor | 302,177 | 2 | 1 | 0 | 76,056 | 25.17% | 37.33% | 62.50% | 0.00% | 0.17% | 112,803 | 188,859 | 0 | 515 | |
 |  | Insurance Commissioner | 303,613 | 2 | 1 | 0 | 80,932 | 26.66% | 36.59% | 63.25% | 0.00% | 0.16% | 111,099 | 192,031 | 0 | 483 |
| Map | Pie | Initiative | Total Vote | N | Y | Margin | %Margin | No | Yes | Oth. | No | Yes | ||||
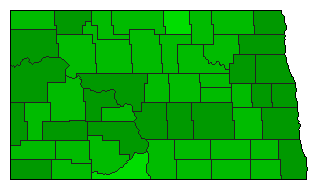 | Referendum | 288,668 | 2 | 0 | 1 | 123,632 | 42.83% | 28.59% | 0.00% | 71.41% | 0.00% | 82,518 | 0 | 206,150 | 0 | |
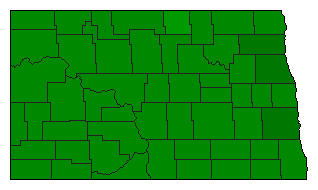 | Referendum | 292,423 | 2 | 0 | 1 | 226,571 | 77.48% | 11.26% | 0.00% | 88.74% | 0.00% | 32,926 | 0 | 259,497 | 0 | |
North Dakota Results for 2012
Login
© Dave Leip's Atlas of U.S. Elections, LLC 2019 All Rights Reserved
Note: The advertisement links below may advocate political positions that this site does not endorse.
Login
© Dave Leip's Atlas of U.S. Elections, LLC 2019 All Rights Reserved
Note: The advertisement links below may advocate political positions that this site does not endorse.