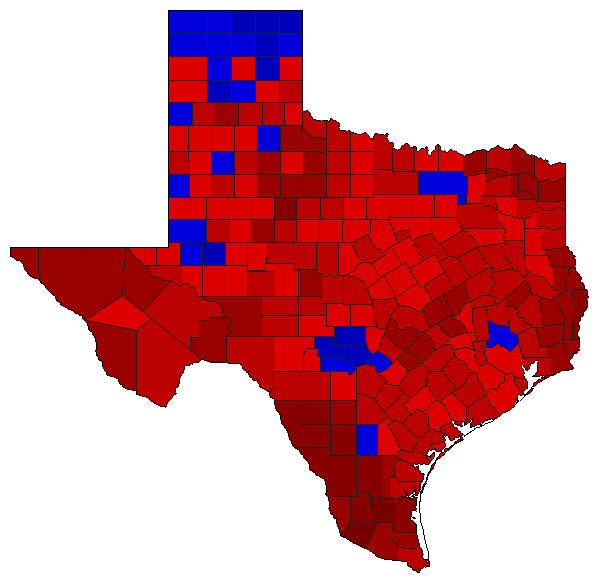
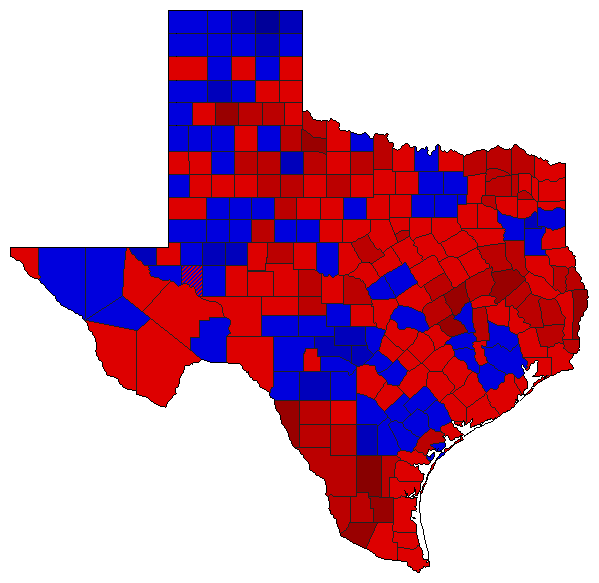
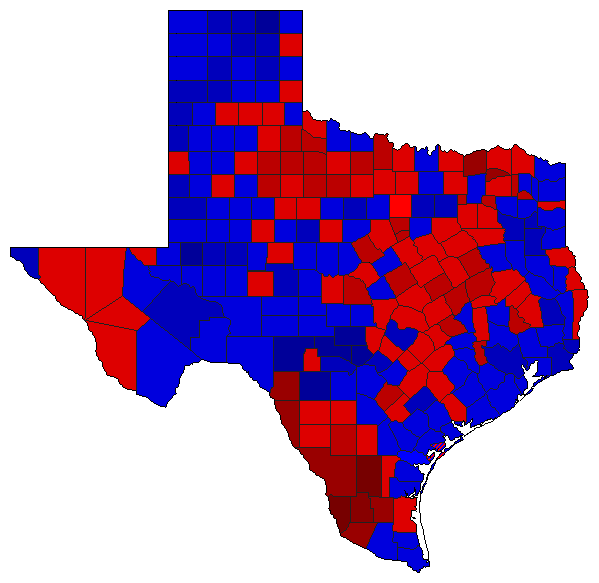
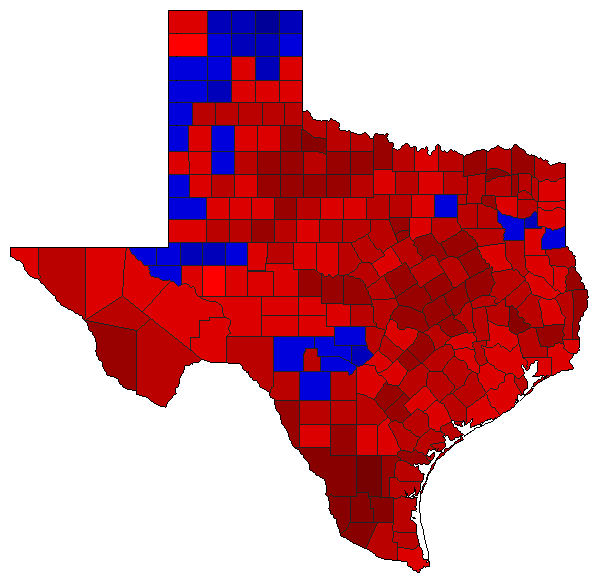
Senatorial General Election Results Comparison - Texas
| Map | Pie | Year | Total | D | R | I | Margin | %Margin | Dem | Rep | Ind | Oth. | Dem | Rep | Ind | Other |
| 2020 | 11,144,040 | 2 | 1 | 0 | 1,074,219 | 9.64% | 43.87% | 53.51% | 0.00% | 2.62% | 4,888,764 | 5,962,983 | 0 | 292,293 | ||
| 2018 | 8,371,655 | 2 | 1 | 0 | 214,921 | 2.57% | 48.33% | 50.89% | 0.00% | 0.78% | 4,045,632 | 4,260,553 | 0 | 65,470 | ||
| 2014 | 4,648,358 | 2 | 1 | 0 | 1,264,144 | 27.20% | 34.36% | 61.56% | 0.00% | 4.08% | 1,597,387 | 2,861,531 | 0 | 189,440 | ||
| 2012 | 7,864,822 | 2 | 1 | 0 | 1,245,210 | 15.83% | 40.62% | 56.46% | 0.00% | 2.92% | 3,194,927 | 4,440,137 | 0 | 229,758 | ||
| 2008 | 7,912,075 | 2 | 1 | 0 | 948,104 | 11.98% | 42.84% | 54.82% | 0.00% | 2.34% | 3,389,365 | 4,337,469 | 0 | 185,241 | ||
| 2006 | 4,314,663 | 2 | 1 | 0 | 1,106,587 | 25.65% | 36.04% | 61.69% | 0.00% | 2.26% | 1,555,202 | 2,661,789 | 0 | 97,672 | ||
| 2002 | 4,514,012 | 2 | 1 | 0 | 540,485 | 11.97% | 43.33% | 55.30% | 0.00% | 1.37% | 1,955,758 | 2,496,243 | 0 | 62,011 | ||
| 2000 | 6,276,652 | 2 | 1 | 0 | 2,051,776 | 32.69% | 32.35% | 65.04% | 0.00% | 2.62% | 2,030,315 | 4,082,091 | 0 | 164,246 | ||
| 1996 | 5,527,441 | 2 | 1 | 0 | 598,904 | 10.84% | 43.94% | 54.78% | 0.00% | 1.28% | 2,428,776 | 3,027,680 | 0 | 70,985 | ||
| 1994 | 4,279,940 | 2 | 1 | 0 | 964,603 | 22.54% | 38.31% | 60.85% | 0.00% | 0.84% | 1,639,615 | 2,604,218 | 0 | 36,107 | ||
| 1990 | 3,822,157 | 2 | 1 | 0 | 872,371 | 22.82% | 37.41% | 60.24% | 0.00% | 2.35% | 1,429,986 | 2,302,357 | 0 | 89,814 | ||
 | 1988 | 5,279,034 | 1 | 2 | 0 | 1,020,578 | 19.33% | 59.67% | 40.33% | 0.00% | 0.00% | 3,149,806 | 2,129,228 | 0 | 0 | |
 | 1978 | 2,312,540 | 2 | 1 | 0 | 12,227 | 0.53% | 49.26% | 49.79% | 0.00% | 0.95% | 1,139,149 | 1,151,376 | 0 | 22,015 | |
 | 1966 | 1,493,134 | 2 | 1 | 3 | 198,646 | 13.30% | 43.12% | 56.43% | 0.45% | 0.00% | 643,855 | 842,501 | 6,778 | 0 | |
 | 1964 | 2,603,837 | 1 | 2 | 0 | 329,621 | 12.66% | 56.22% | 43.56% | 0.00% | 0.21% | 1,463,958 | 1,134,337 | 0 | 5,542 |
Texas Results for 2012
Login
© Dave Leip's Atlas of U.S. Elections, LLC 2019 All Rights Reserved
Note: The advertisement links below may advocate political positions that this site does not endorse.
Login
© Dave Leip's Atlas of U.S. Elections, LLC 2019 All Rights Reserved
Note: The advertisement links below may advocate political positions that this site does not endorse.