2012 General Election Results Comparison - West Virginia
| Map | Pie | Office | Total | D | R | I | Margin | %Margin | Dem | Rep | Ind | Oth. | Dem | Rep | Ind | Other |
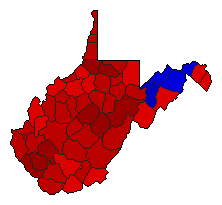
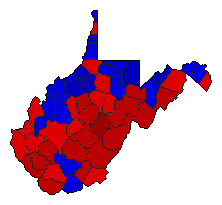
 |  | President | 672,119 | 2 | 1 | - | 179,386 | 26.69% | 35.45% | 62.14% | 0.00% | 2.41% | 238,269 | 417,655 | 0 | 16,195 |
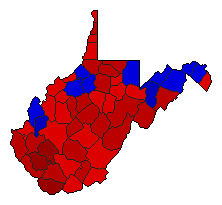
 |  | Senator | 660,202 | 1 | 2 | 0 | 159,111 | 24.10% | 60.57% | 36.47% | 0.00% | 2.96% | 399,898 | 240,787 | 0 | 19,517 |
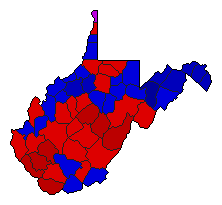
 |  | Governor | 664,534 | 1 | 2 | 0 | 32,177 | 4.84% | 50.48% | 45.64% | 0.00% | 3.88% | 335,468 | 303,291 | 0 | 25,775 |
 | Secretary of State | 638,543 | 1 | 2 | 0 | 158,383 | 24.80% | 62.40% | 37.60% | 0.00% | 0.00% | 398,463 | 240,080 | 0 | 0 | |
 | State Treasurer | 628,583 | 1 | 2 | 0 | 67,951 | 10.81% | 55.41% | 44.59% | 0.00% | 0.00% | 348,267 | 280,316 | 0 | 0 | |
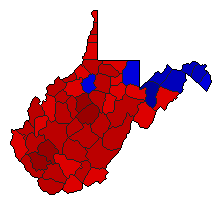
 | Attorney General | 643,684 | 2 | 1 | 0 | 16,024 | 2.49% | 48.76% | 51.24% | 0.00% | 0.00% | 313,830 | 329,854 | 0 | 0 | |
 | State Auditor | 619,569 | 1 | 2 | 0 | 91,651 | 14.79% | 57.40% | 42.60% | 0.00% | 0.00% | 355,610 | 263,959 | 0 | 0 | |
 | Agriculture Commissioner | 613,679 | 1 | 2 | 0 | 19,503 | 3.18% | 51.59% | 48.41% | 0.00% | 0.00% | 316,591 | 297,088 | 0 | 0 |
West Virginia Results for 2012
Login
© Dave Leip's Atlas of U.S. Elections, LLC 2019 All Rights Reserved
Note: The advertisement links below may advocate political positions that this site does not endorse.
Login
© Dave Leip's Atlas of U.S. Elections, LLC 2019 All Rights Reserved
Note: The advertisement links below may advocate political positions that this site does not endorse.