State Treasurer General Election Results Comparison - West Virginia
| Map | Pie | Year | Total | D | R | I | Margin | %Margin | Dem | Rep | Ind | Oth. | Dem | Rep | Ind | Other |
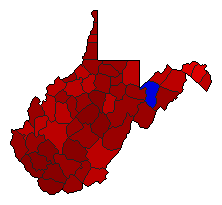
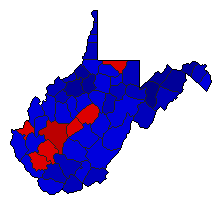 |  | 2020 | 756,061 | 2 | 1 | 0 | 95,429 | 12.62% | 43.69% | 56.31% | 0.00% | 0.00% | 330,316 | 425,745 | 0 | 0 |
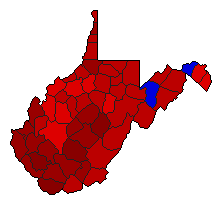
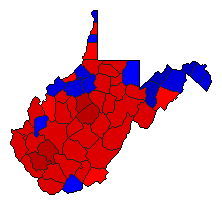 |  | 2016 | 671,554 | 1 | 2 | 0 | 44,347 | 6.60% | 50.33% | 43.73% | 0.00% | 5.94% | 338,018 | 293,671 | 0 | 39,865 |
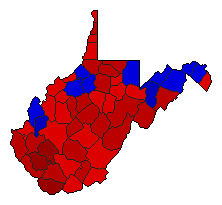 | 2012 | 628,583 | 1 | 2 | 0 | 67,951 | 10.81% | 55.41% | 44.59% | 0.00% | 0.00% | 348,267 | 280,316 | 0 | 0 | |
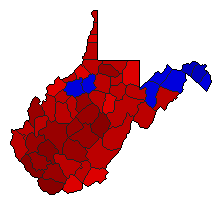 | 2004 | 688,275 | 1 | 2 | 0 | 178,183 | 25.89% | 62.94% | 37.06% | 0.00% | 0.00% | 433,229 | 255,046 | 0 | 0 | |
 | 1992 | 572,069 | 1 | 2 | 0 | 252,125 | 44.07% | 72.04% | 27.96% | 0.00% | 0.00% | 412,097 | 159,972 | 0 | 0 | |
 | 1984 | 692,409 | 1 | 2 | 0 | 226,027 | 32.64% | 66.32% | 33.68% | 0.00% | 0.00% | 459,218 | 233,191 | 0 | 0 |
West Virginia Results for 2012
Login
© Dave Leip's Atlas of U.S. Elections, LLC 2019 All Rights Reserved
Note: The advertisement links below may advocate political positions that this site does not endorse.
Login
© Dave Leip's Atlas of U.S. Elections, LLC 2019 All Rights Reserved
Note: The advertisement links below may advocate political positions that this site does not endorse.