Note: The Google advertisement links below may advocate political positions that this site does not endorse.
| Map | Pie | Year | Total | D | R | I | Margin | %Margin | Dem | Rep | Ind | Oth. | Dem | Rep | Ind | Other | | | | | | | | | | | | | | | | | | |
|---|
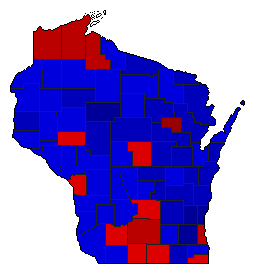 | | 2012 |
2,461,336 |
2 |
1 |
0 |
145,219 |
5.90% |
46.99% |
52.89% |
0.00% |
0.13% |
1,156,520 |
1,301,739 |
0 |
3,077 |
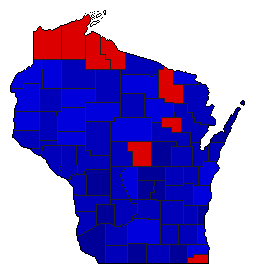 |  | 1968 |
1,610,332 |
2 |
1 |
0 |
300,546 |
18.66% |
40.67% |
59.33% |
0.00% |
0.00% |
654,893 |
955,439 |
0 |
0 |
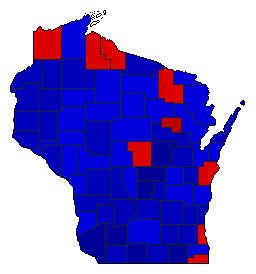 |  | 1966 |
1,143,013 |
2 |
1 |
0 |
115,451 |
10.10% |
44.95% |
55.05% |
0.00% |
0.00% |
513,781 |
629,232 |
0 |
0 |
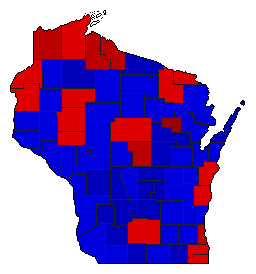 |  | 1964 |
1,643,111 |
1 |
2 |
0 |
40,829 |
2.48% |
51.24% |
48.76% |
0.00% |
0.00% |
841,970 |
801,141 |
0 |
0 |
|
