| Map | Pie | Year | Total | D | R | I | Margin | %Margin | Dem | Rep | Ind | Oth. | Dem | Rep | Ind | Other | | | | | | | | | | | | | | | | | | |
|---|
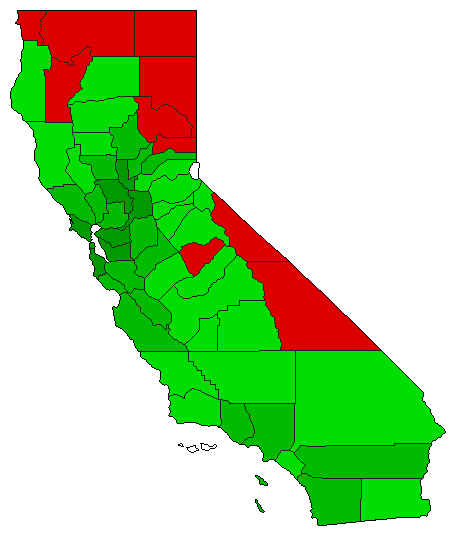
 |  | 2020 |
17,092,124 |
1 |
0 |
2 |
2,063,490 |
12.07% |
56.04% |
0.00% |
43.96% |
0.00% |
9,577,807 |
0 |
7,514,317 |
0 |
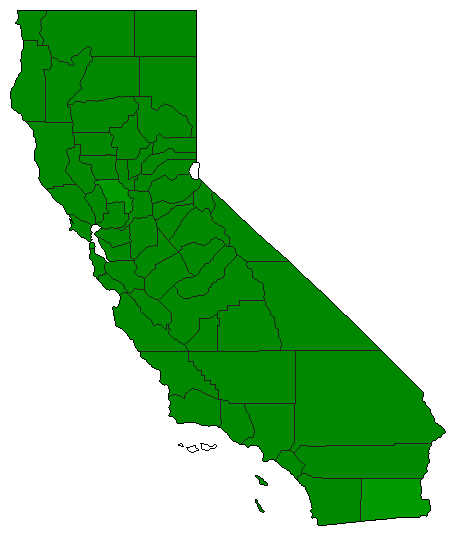
 |  | 2016 |
13,454,424 |
2 |
0 |
1 |
5,401,004 |
40.14% |
29.93% |
0.00% |
70.07% |
0.00% |
4,026,710 |
0 |
9,427,714 |
0 |
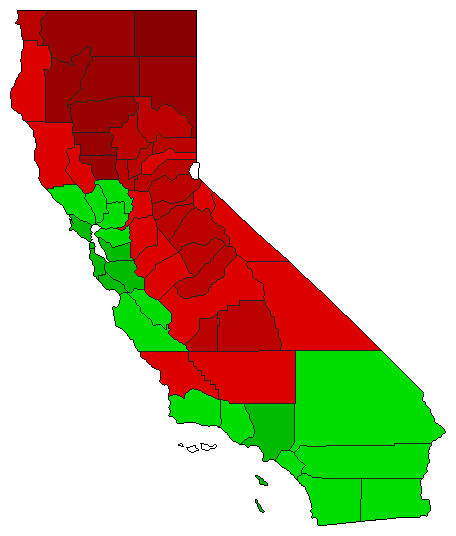
 | | 2012 |
12,434,507 |
1 |
0 |
2 |
486,021 |
3.91% |
51.95% |
0.00% |
48.05% |
0.00% |
6,460,264 |
0 |
5,974,243 |
0 |
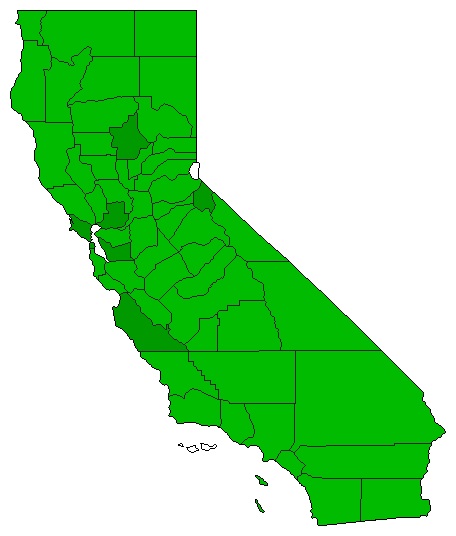
 | | 2008 |
12,696,429 |
2 |
0 |
1 |
664,541 |
5.23% |
47.38% |
0.00% |
52.62% |
0.00% |
6,015,944 |
0 |
6,680,485 |
0 |
 | | 2006 |
8,268,398 |
2 |
0 |
1 |
2,343,306 |
28.34% |
35.83% |
0.00% |
64.17% |
0.00% |
2,962,546 |
0 |
5,305,852 |
0 |
 | | 2004 |
11,251,200 |
2 |
0 |
1 |
7,571,196 |
67.29% |
16.35% |
0.00% |
83.65% |
0.00% |
1,840,002 |
0 |
9,411,198 |
0 |
 | | 2002 |
7,021,596 |
2 |
0 |
1 |
742,640 |
10.58% |
44.71% |
0.00% |
55.29% |
0.00% |
3,139,478 |
0 |
3,882,118 |
0 |
 | | 2000 |
10,038,296 |
2 |
0 |
1 |
3,449,676 |
34.37% |
32.82% |
0.00% |
67.18% |
0.00% |
3,294,310 |
0 |
6,743,986 |
0 |
 | | 1998 |
7,812,118 |
2 |
0 |
1 |
1,161,860 |
14.87% |
42.56% |
0.00% |
57.44% |
0.00% |
3,325,129 |
0 |
4,486,989 |
0 |
|
