2012 General Election Results Comparison - California
| Map | Pie | Office | Total | D | R | I | Margin | %Margin | Dem | Rep | Ind | Oth. | Dem | Rep | Ind | Other |
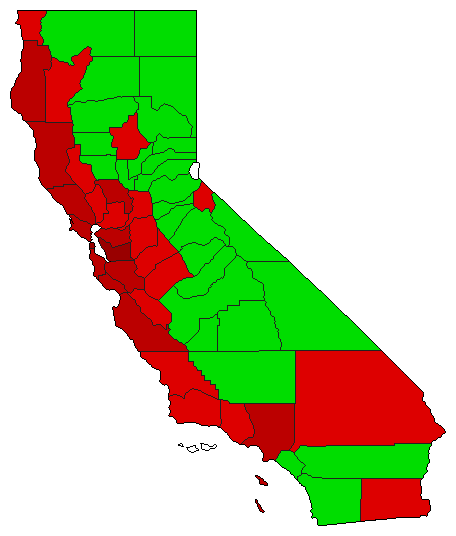
 |  | President | 13,055,815 | 1 | 2 | - | 3,014,327 | 23.09% | 60.16% | 37.07% | 0.00% | 2.77% | 7,854,285 | 4,839,958 | 0 | 361,572 |
 |  | Senator | 12,578,511 | 1 | 2 | 0 | 3,150,737 | 25.05% | 62.52% | 37.48% | 0.00% | 0.00% | 7,864,624 | 4,713,887 | 0 | 0 |
| Map | Pie | Initiative | Total Vote | N | Y | Margin | %Margin | No | Yes | Oth. | No | Yes | ||||
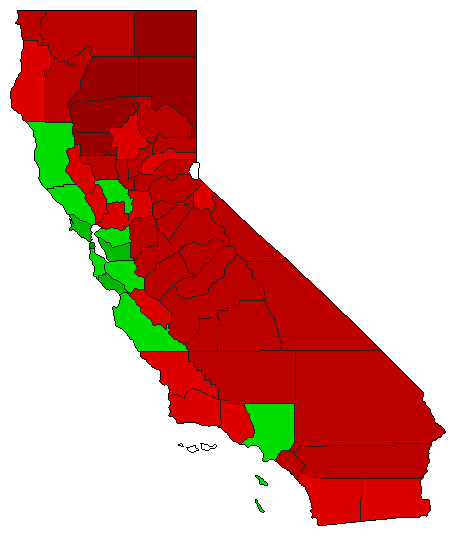
 | Initiative | 12,444,135 | 1 | 0 | 2 | 1,643,699 | 13.21% | 56.60% | 0.00% | 43.40% | 0.00% | 7,043,917 | 0 | 5,400,218 | 0 | |
 | Initiative | 12,434,507 | 1 | 0 | 2 | 486,021 | 3.91% | 51.95% | 0.00% | 48.05% | 0.00% | 6,460,264 | 0 | 5,974,243 | 0 | |
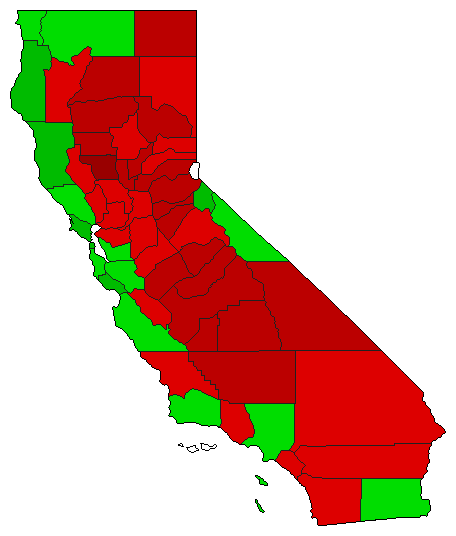 | Initiative | 12,531,085 | 1 | 0 | 2 | 353,657 | 2.82% | 51.41% | 0.00% | 48.59% | 0.00% | 6,442,371 | 0 | 6,088,714 | 0 | |
California Results for 2012
Login
© Dave Leip's Atlas of U.S. Elections, LLC 2019 All Rights Reserved
Note: The advertisement links below may advocate political positions that this site does not endorse.
Login
© Dave Leip's Atlas of U.S. Elections, LLC 2019 All Rights Reserved
Note: The advertisement links below may advocate political positions that this site does not endorse.