| Map | Pie | Year | Total | D | R | I | Margin | %Margin | Dem | Rep | Ind | Oth. | Dem | Rep | Ind | Other | | | | | | | | | | | | | | | | | | |
|---|
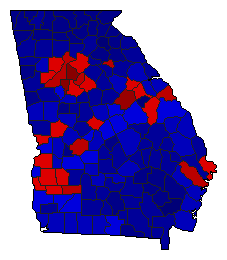
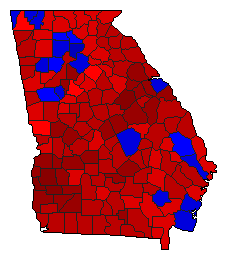
|  | 2022 |
3,905,762 |
2 |
1 |
0 |
317,678 |
8.13% |
44.84% |
52.97% |
0.00% |
2.19% |
1,751,214 |
2,068,892 |
0 |
85,656 |
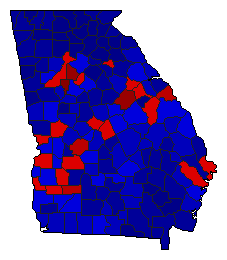
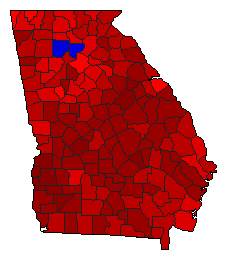
 |  | 2018 |
3,843,480 |
2 |
1 |
0 |
236,714 |
6.16% |
46.92% |
53.08% |
0.00% |
0.00% |
1,803,383 |
2,040,097 |
0 |
0 |
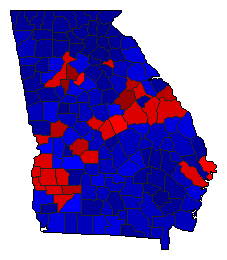
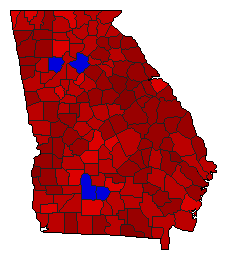
 | | 2014 |
2,509,378 |
2 |
1 |
0 |
414,700 |
16.53% |
41.74% |
58.26% |
0.00% |
0.00% |
1,047,339 |
1,462,039 |
0 |
0 |
 | | 2010 |
2,545,566 |
2 |
1 |
3 |
399,373 |
15.69% |
40.36% |
56.05% |
3.59% |
0.00% |
1,027,373 |
1,426,746 |
91,447 |
0 |
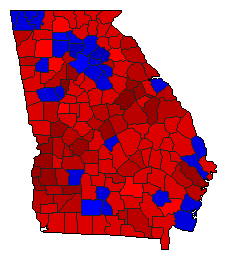 | | 2006 |
2,084,781 |
1 |
2 |
3 |
321,976 |
15.44% |
56.04% |
40.60% |
3.36% |
0.00% |
1,168,371 |
846,395 |
70,015 |
0 |
 | | 2002 |
1,983,914 |
1 |
2 |
3 |
362,181 |
18.26% |
57.40% |
39.14% |
3.46% |
0.00% |
1,138,705 |
776,524 |
68,685 |
0 |
 | | 1998 |
1,728,679 |
1 |
2 |
3 |
500,030 |
28.93% |
62.80% |
33.88% |
3.32% |
0.00% |
1,085,694 |
585,664 |
57,321 |
0 |
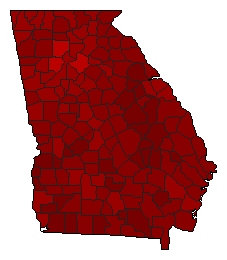 | | 1994 |
1,333,035 |
1 |
2 |
0 |
730,743 |
54.82% |
77.41% |
22.59% |
0.00% |
0.00% |
1,031,889 |
301,146 |
0 |
0 |
 | | 1990 |
1,328,088 |
1 |
2 |
0 |
347,218 |
26.14% |
63.07% |
36.93% |
0.00% |
0.00% |
837,653 |
490,435 |
0 |
0 |
|
