Note: The Google advertisement links below may advocate political positions that this site does not endorse.
| Map | Pie | Office | Total | D | R | I | Margin | %Margin | Dem | Rep | Ind | Oth. | Dem | Rep | Ind | Other | | | | | | | | | | | | | | | | | | |
|---|
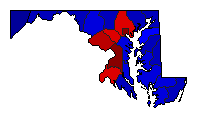
 |  | Governor |
1,733,177 |
2 |
1 |
0 |
65,510 |
3.78% |
47.25% |
51.03% |
0.00% |
1.72% |
818,890 |
884,400 |
0 |
29,887 |
 | | Attorney General |
1,677,269 |
1 |
2 |
3 |
253,581 |
15.12% |
55.80% |
40.68% |
3.40% |
0.12% |
935,846 |
682,265 |
57,069 |
2,089 |
 | | Comptroller General |
1,693,896 |
1 |
2 |
4 |
431,158 |
25.45% |
62.65% |
37.20% |
0.04% |
0.11% |
1,061,267 |
630,109 |
595 |
1,925 |
|
