| Map | Pie | Office | Total | D | R | I | Margin | %Margin | Dem | Rep | Ind | Oth. | Dem | Rep | Ind | Other | | | | | | | | | | | | | | | | | | |
|---|
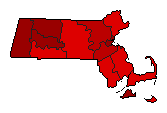
 |  | Senator |
2,084,972 |
1 |
2 |
0 |
497,994 |
23.88% |
61.87% |
37.98% |
0.00% |
0.15% |
1,289,944 |
791,950 |
0 |
3,078 |
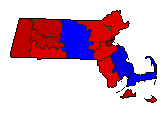
 |  | Governor |
2,158,326 |
2 |
1 |
5 |
40,165 |
1.86% |
46.54% |
48.40% |
0.75% |
4.31% |
1,004,408 |
1,044,573 |
16,295 |
93,050 |
 | | Secretary of State |
2,069,317 |
1 |
2 |
3 |
798,125 |
38.57% |
67.44% |
28.87% |
3.61% |
0.07% |
1,395,616 |
597,491 |
74,789 |
1,421 |
 | | State Treasurer |
2,032,658 |
1 |
2 |
3 |
291,298 |
14.33% |
55.11% |
40.78% |
4.03% |
0.08% |
1,120,192 |
828,894 |
81,907 |
1,665 |
 | | Attorney General |
2,076,219 |
1 |
2 |
0 |
486,692 |
23.44% |
61.68% |
38.23% |
0.00% |
0.09% |
1,280,513 |
793,821 |
0 |
1,885 |
 | | State Auditor |
1,987,694 |
1 |
2 |
3 |
389,774 |
19.61% |
57.70% |
38.10% |
4.10% |
0.10% |
1,146,987 |
757,213 |
81,430 |
2,064 |
| | | Map | Pie | Initiative | Total Vote | N | | Y | Margin | %Margin | No | | Yes | Oth. | No | | Yes | |
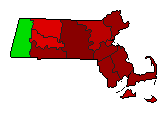
 | | Initiative |
2,067,500 |
2 |
0 |
1 |
122,958 |
5.95% |
47.03% |
0.00% |
52.97% |
0.00% |
972,271 |
0 |
1,095,229 |
0 |
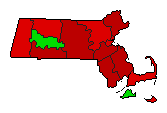
 | | Initiative |
2,125,972 |
1 |
0 |
2 |
997,210 |
46.91% |
73.45% |
0.00% |
26.55% |
0.00% |
1,561,591 |
0 |
564,381 |
0 |
 | | Initiative |
2,117,284 |
1 |
0 |
2 |
425,524 |
20.10% |
60.05% |
0.00% |
39.95% |
0.00% |
1,271,404 |
0 |
845,880 |
0 |
 | | Initiative |
2,116,462 |
2 |
0 |
1 |
397,220 |
18.77% |
40.62% |
0.00% |
59.38% |
0.00% |
859,621 |
0 |
1,256,841 |
0 |
|
