2014 General Election Results Comparison - Minnesota
| Map | Pie | Office | Total | D | R | I | Margin | %Margin | Dem | Rep | Ind | Oth. | Dem | Rep | Ind | Other |
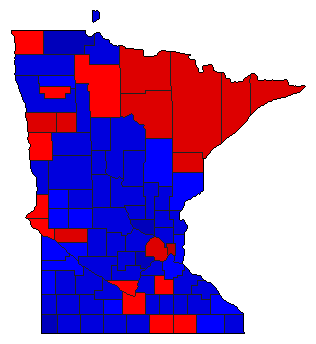
 |  | Senator | 1,981,590 | 1 | 2 | 3 | 202,978 | 10.24% | 53.15% | 42.91% | 2.40% | 1.55% | 1,053,205 | 850,227 | 47,530 | 30,628 |
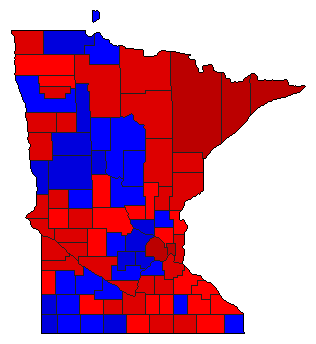
 |  | Governor | 1,975,432 | 1 | 2 | 3 | 109,856 | 5.56% | 50.07% | 44.51% | 2.88% | 2.54% | 989,113 | 879,257 | 56,900 | 50,162 |
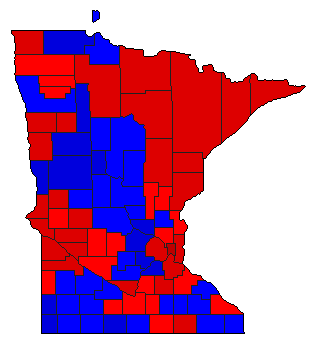
 |  | Secretary of State | 1,916,400 | 1 | 2 | 3 | 22,428 | 1.17% | 47.04% | 45.87% | 4.91% | 2.18% | 901,450 | 879,022 | 94,065 | 41,863 |
 |  | Attorney General | 1,928,980 | 1 | 2 | 4 | 262,171 | 13.59% | 52.60% | 39.01% | 2.31% | 6.07% | 1,014,714 | 752,543 | 44,613 | 117,110 |
 |  | State Auditor | 1,918,090 | 1 | 2 | 3 | 221,288 | 11.54% | 51.51% | 39.98% | 4.01% | 4.50% | 988,102 | 766,814 | 76,845 | 86,329 |
Minnesota Results for 2014
Login
© Dave Leip's Atlas of U.S. Elections, LLC 2019 All Rights Reserved
Note: The advertisement links below may advocate political positions that this site does not endorse.
Login
© Dave Leip's Atlas of U.S. Elections, LLC 2019 All Rights Reserved
Note: The advertisement links below may advocate political positions that this site does not endorse.