| Map | Pie | Office | Total | D | R | I | Margin | %Margin | Dem | Rep | Ind | Oth. | Dem | Rep | Ind | Other | | | | | | | | | | | | | | | | | | |
|---|
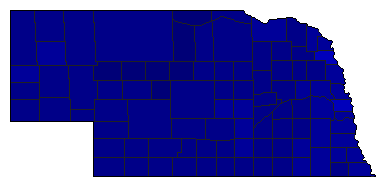
 |  | Senator |
540,337 |
2 |
1 |
3 |
177,509 |
32.85% |
31.49% |
64.34% |
2.94% |
1.24% |
170,127 |
347,636 |
15,868 |
6,706 |
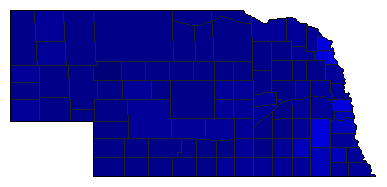
 |  | Governor |
540,202 |
2 |
1 |
0 |
96,846 |
17.93% |
39.23% |
57.15% |
0.00% |
3.62% |
211,905 |
308,751 |
0 |
19,546 |
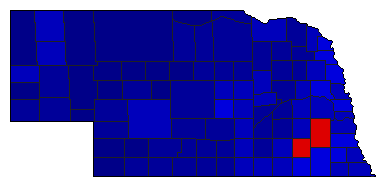
 | | Secretary of State |
489,605 |
0 |
1 |
2 |
246,665 |
50.38% |
0.00% |
75.19% |
24.81% |
0.00% |
0 |
368,135 |
121,470 |
0 |
 | | State Treasurer |
524,584 |
2 |
1 |
3 |
218,373 |
41.63% |
26.52% |
68.14% |
5.34% |
0.00% |
139,101 |
357,474 |
28,009 |
0 |
 | | Attorney General |
514,460 |
2 |
1 |
0 |
165,232 |
32.12% |
33.94% |
66.06% |
0.00% |
0.00% |
174,614 |
339,846 |
0 |
0 |
 | | State Auditor |
498,909 |
2 |
1 |
0 |
90,467 |
18.13% |
40.93% |
59.07% |
0.00% |
0.00% |
204,221 |
294,688 |
0 |
0 |
| | | Map | Pie | Initiative | Total Vote | N | | Y | Margin | %Margin | No | | Yes | Oth. | No | | Yes | |
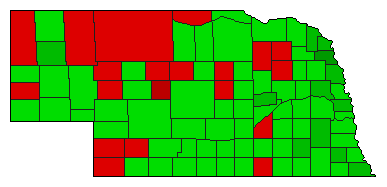 | | Initiative |
523,616 |
2 |
0 |
1 |
99,186 |
18.94% |
40.53% |
0.00% |
59.47% |
0.00% |
212,215 |
0 |
311,401 |
0 |
|
