Note: The Google advertisement links below may advocate political positions that this site does not endorse.
| Map | Pie | Office | Total | D | R | I | Margin | %Margin | Dem | Rep | Ind | Oth. | Dem | Rep | Ind | Other | | | | | | | | | | | | | | | | | | |
|---|
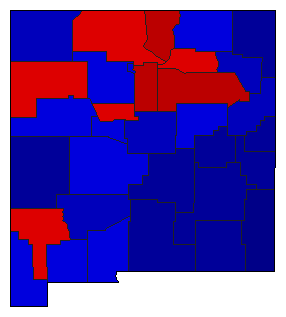
 |  | Senator |
515,506 |
1 |
2 |
0 |
57,312 |
11.12% |
55.56% |
44.44% |
0.00% |
0.00% |
286,409 |
229,097 |
0 |
0 |
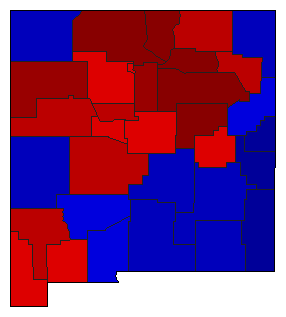
 |  | Governor |
512,805 |
2 |
1 |
0 |
74,081 |
14.45% |
42.78% |
57.22% |
0.00% |
0.00% |
219,362 |
293,443 |
0 |
0 |
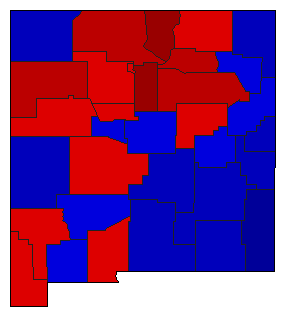
 |  | Secretary of State |
507,625 |
2 |
1 |
0 |
16,609 |
3.27% |
48.36% |
51.64% |
0.00% |
0.00% |
245,508 |
262,117 |
0 |
0 |
 | | State Treasurer |
497,902 |
1 |
2 |
0 |
24,504 |
4.92% |
52.46% |
47.54% |
0.00% |
0.00% |
261,203 |
236,699 |
0 |
0 |
 |  | Attorney General |
506,311 |
1 |
2 |
0 |
83,705 |
16.53% |
58.27% |
41.73% |
0.00% |
0.00% |
295,008 |
211,303 |
0 |
0 |
 | | State Auditor |
498,405 |
1 |
2 |
0 |
42,367 |
8.50% |
54.25% |
45.75% |
0.00% |
0.00% |
270,386 |
228,019 |
0 |
0 |
|
