2014 General Election Results Comparison - North Dakota
| Map | Pie | Office | Total | D | R | I | Margin | %Margin | Dem | Rep | Ind | Oth. | Dem | Rep | Ind | Other |
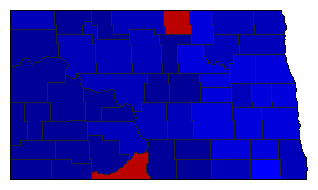
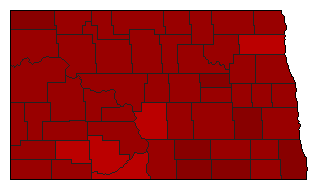
 |  | US Representative | 248,670 | 2 | 1 | 0 | 42,422 | 17.06% | 38.48% | 55.54% | 0.00% | 5.99% | 95,678 | 138,100 | 0 | 14,892 |
 | Secretary of State | 243,757 | 2 | 1 | 3 | 73,611 | 30.20% | 32.19% | 62.39% | 5.30% | 0.11% | 78,474 | 152,085 | 12,920 | 278 | |
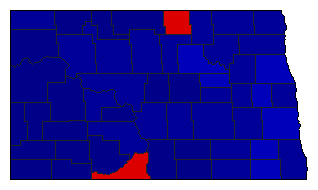 | Attorney General | 245,328 | 2 | 1 | 0 | 118,423 | 48.27% | 25.78% | 74.06% | 0.00% | 0.16% | 63,255 | 181,678 | 0 | 395 | |
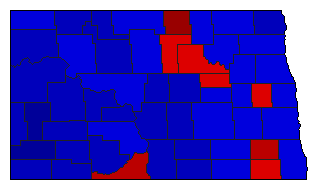 | Agriculture Commissioner | 245,068 | 2 | 1 | 0 | 34,503 | 14.08% | 42.88% | 56.96% | 0.00% | 0.15% | 105,094 | 139,597 | 0 | 377 | |
| Map | Pie | Initiative | Total Vote | N | Y | Margin | %Margin | No | Yes | Oth. | No | Yes | ||||
 | Referendum | 251,527 | 1 | 0 | 2 | 71,079 | 28.26% | 64.13% | 0.00% | 35.87% | 0.00% | 161,303 | 0 | 90,224 | 0 | |
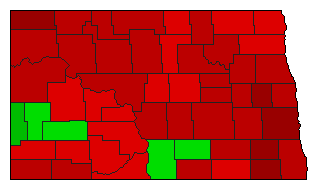
 | Referendum | 248,761 | 2 | 0 | 1 | 127,805 | 51.38% | 24.31% | 0.00% | 75.69% | 0.00% | 60,478 | 0 | 188,283 | 0 | |
 | Referendum | 243,499 | 1 | 0 | 2 | 121,485 | 49.89% | 74.95% | 0.00% | 25.05% | 0.00% | 182,492 | 0 | 61,007 | 0 | |
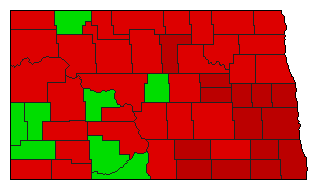 | Referendum | 240,144 | 1 | 0 | 2 | 31,654 | 13.18% | 56.59% | 0.00% | 43.41% | 0.00% | 135,899 | 0 | 104,245 | 0 | |
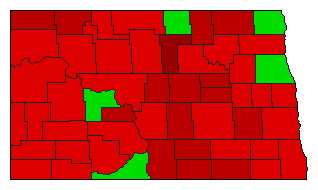 | Initiative | 246,452 | 1 | 0 | 2 | 27,474 | 11.15% | 55.57% | 0.00% | 44.43% | 0.00% | 136,963 | 0 | 109,489 | 0 | |
North Dakota Results for 2014
Login
© Dave Leip's Atlas of U.S. Elections, LLC 2019 All Rights Reserved
Note: The advertisement links below may advocate political positions that this site does not endorse.
Login
© Dave Leip's Atlas of U.S. Elections, LLC 2019 All Rights Reserved
Note: The advertisement links below may advocate political positions that this site does not endorse.