| Map | Pie | Office | Total | D | R | I | Margin | %Margin | Dem | Rep | Ind | Oth. | Dem | Rep | Ind | Other | | | | | | | | | | | | | | | | | | |
|---|
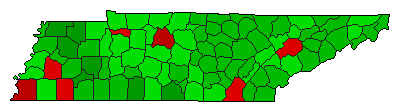
 |  | Senator |
1,374,060 |
2 |
1 |
10 |
412,239 |
30.00% |
31.87% |
61.87% |
0.17% |
6.10% |
437,848 |
850,087 |
2,314 |
83,811 |
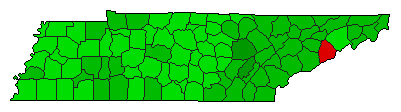
 |  | Governor |
1,353,728 |
2 |
1 |
3 |
642,559 |
47.47% |
22.84% |
70.31% |
2.26% |
4.59% |
309,237 |
951,796 |
30,579 |
62,116 |
| | | Map | Pie | Initiative | Total Vote | N | | Y | Margin | %Margin | No | | Yes | Oth. | No | | Yes | |
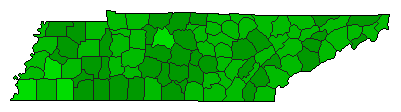
 | | Referendum |
1,385,178 |
2 |
0 |
1 |
72,324 |
5.22% |
47.39% |
0.00% |
52.61% |
0.00% |
656,427 |
0 |
728,751 |
0 |
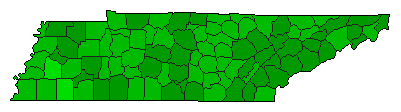
 | | Referendum |
1,365,071 |
2 |
0 |
1 |
298,027 |
21.83% |
39.08% |
0.00% |
60.92% |
0.00% |
533,522 |
0 |
831,549 |
0 |
 | | Referendum |
1,332,325 |
2 |
0 |
1 |
432,193 |
32.44% |
33.78% |
0.00% |
66.22% |
0.00% |
450,066 |
0 |
882,259 |
0 |
 | | Referendum |
1,296,990 |
2 |
0 |
1 |
508,356 |
39.20% |
30.40% |
0.00% |
69.60% |
0.00% |
394,317 |
0 |
902,673 |
0 |
|
