| Map | Pie | Office | Total | D | R | I | Margin | %Margin | Dem | Rep | Ind | Oth. | Dem | Rep | Ind | Other | | | | | | | | | | | | | | | | | | |
|---|
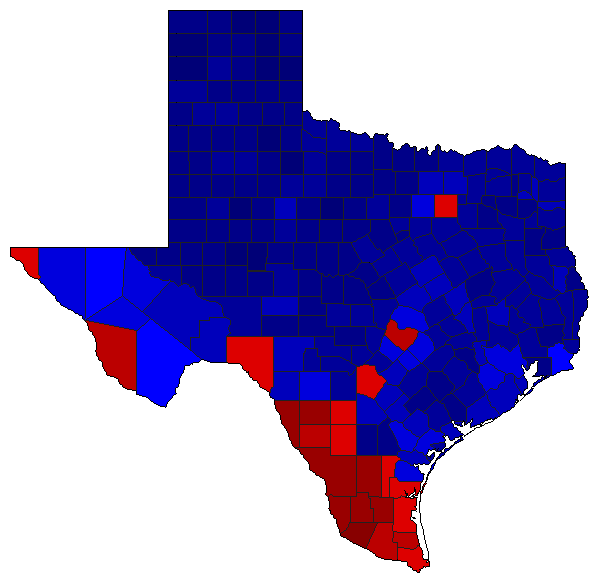
 |  | Senator |
4,648,358 |
2 |
1 |
0 |
1,264,144 |
27.20% |
34.36% |
61.56% |
0.00% |
4.08% |
1,597,387 |
2,861,531 |
0 |
189,440 |
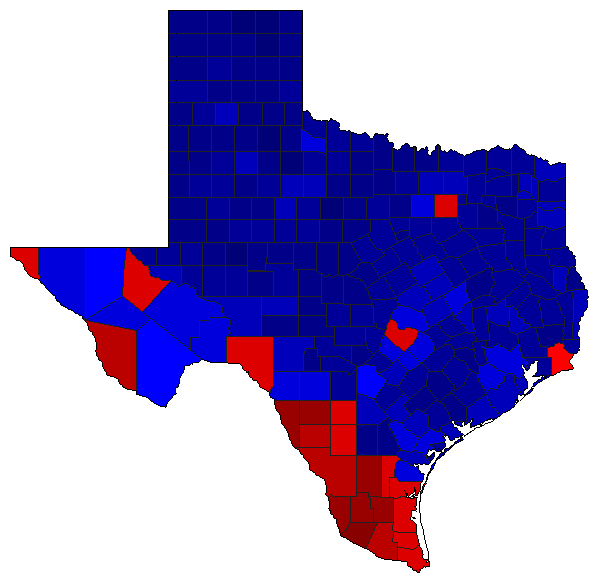
 |  | Governor |
4,718,268 |
2 |
1 |
0 |
960,951 |
20.37% |
38.90% |
59.27% |
0.00% |
1.83% |
1,835,596 |
2,796,547 |
0 |
86,125 |
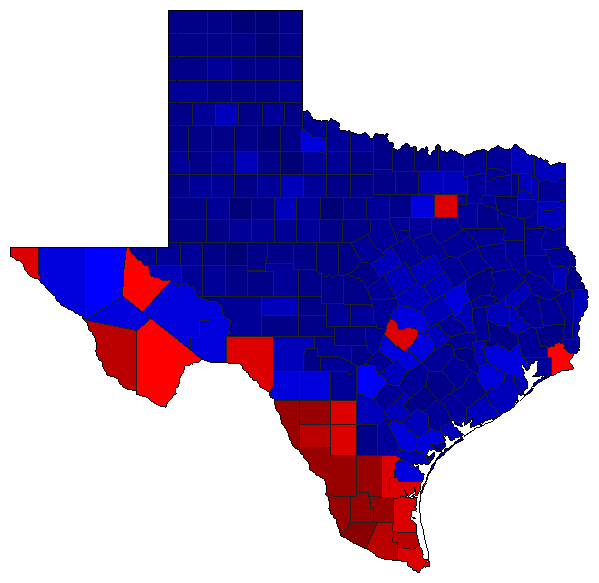
 | | Lt. Governor |
4,686,019 |
2 |
1 |
0 |
910,519 |
19.43% |
38.71% |
58.14% |
0.00% |
3.15% |
1,813,974 |
2,724,493 |
0 |
147,552 |
 |  | Attorney General |
4,663,530 |
2 |
1 |
0 |
969,538 |
20.79% |
38.02% |
58.81% |
0.00% |
3.17% |
1,773,108 |
2,742,646 |
0 |
147,776 |
 |  | Comptroller General |
4,621,846 |
2 |
1 |
0 |
955,758 |
20.68% |
37.69% |
58.37% |
0.00% |
3.93% |
1,742,119 |
2,697,877 |
0 |
181,850 |
 |  | Agriculture Commissioner |
4,605,836 |
2 |
1 |
0 |
1,001,611 |
21.75% |
36.85% |
58.59% |
0.00% |
4.56% |
1,697,083 |
2,698,694 |
0 |
210,059 |
|
