| Map | Pie | Office | Total | D | R | I | Margin | %Margin | Dem | Rep | Ind | Oth. | Dem | Rep | Ind | Other | | | | | | | | | | | | | | | | | | |
|---|
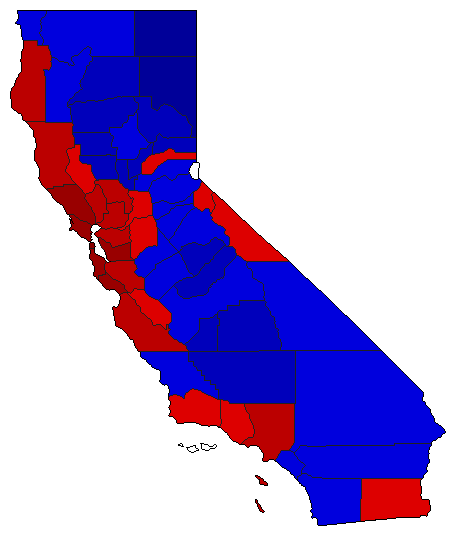
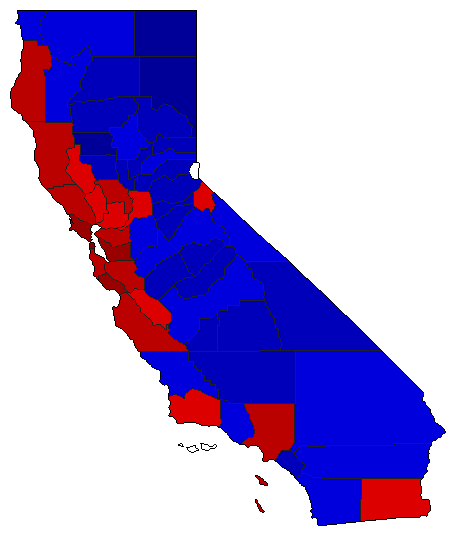
 |  | Governor |
7,317,581 |
1 |
2 |
0 |
1,459,155 |
19.94% |
59.97% |
40.03% |
0.00% |
0.00% |
4,388,368 |
2,929,213 |
0 |
0 |
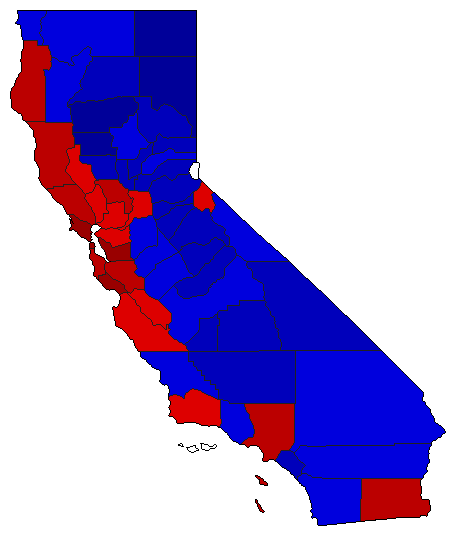
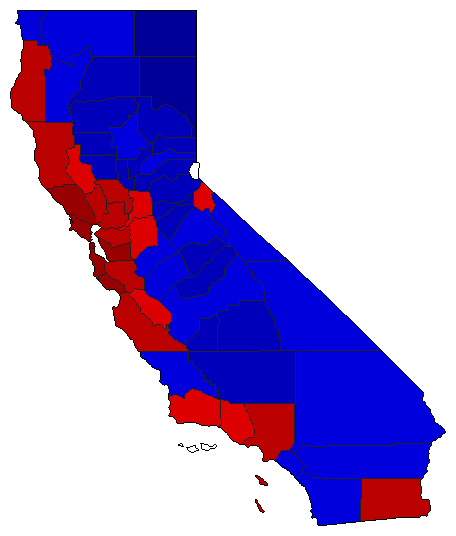
 | | Lt. Governor |
7,185,090 |
1 |
2 |
0 |
1,029,012 |
14.32% |
57.16% |
42.84% |
0.00% |
0.00% |
4,107,051 |
3,078,039 |
0 |
0 |
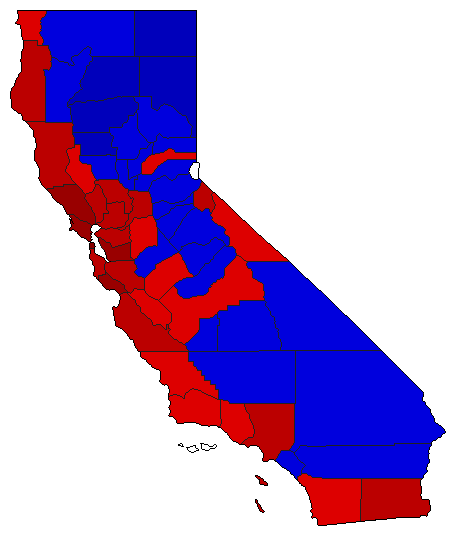
 | | Secretary of State |
7,085,045 |
1 |
2 |
0 |
514,377 |
7.26% |
53.63% |
46.37% |
0.00% |
0.00% |
3,799,711 |
3,285,334 |
0 |
0 |
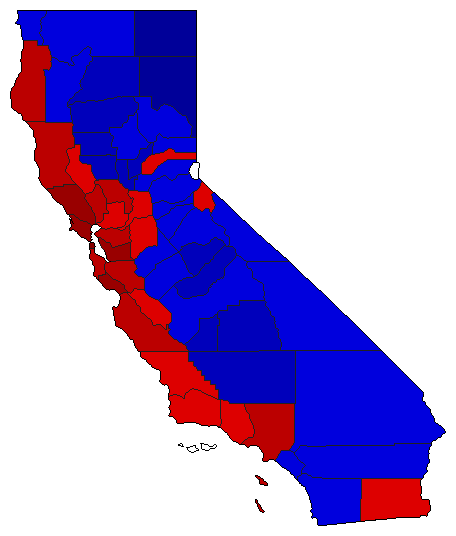
 | | State Treasurer |
7,102,688 |
1 |
2 |
0 |
1,250,898 |
17.61% |
58.81% |
41.19% |
0.00% |
0.00% |
4,176,793 |
2,925,895 |
0 |
0 |
 | | Attorney General |
7,136,125 |
1 |
2 |
0 |
1,069,173 |
14.98% |
57.49% |
42.51% |
0.00% |
0.00% |
4,102,649 |
3,033,476 |
0 |
0 |
 | | Controller |
7,059,972 |
1 |
2 |
0 |
560,636 |
7.94% |
53.97% |
46.03% |
0.00% |
0.00% |
3,810,304 |
3,249,668 |
0 |
0 |
 | | Insurance Commissioner |
7,020,116 |
1 |
2 |
0 |
1,056,214 |
15.05% |
57.52% |
42.48% |
0.00% |
0.00% |
4,038,165 |
2,981,951 |
0 |
0 |
|
