2014 General Election Results Comparison - Colorado
| Map | Pie | Office | Total | D | R | I | Margin | %Margin | Dem | Rep | Ind | Oth. | Dem | Rep | Ind | Other |
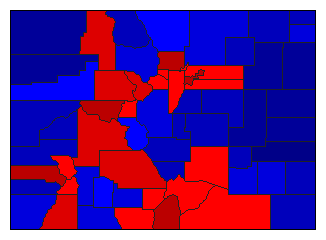
 |  | Senator | 2,041,058 | 2 | 1 | 4 | 39,688 | 1.94% | 46.26% | 48.20% | 1.44% | 4.09% | 944,203 | 983,891 | 29,472 | 83,492 |
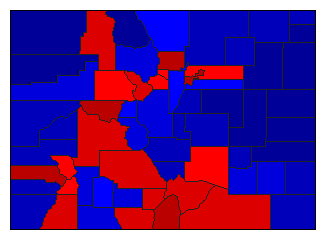
 |  | Governor | 2,041,607 | 1 | 2 | 5 | 68,238 | 3.34% | 49.30% | 45.95% | 1.18% | 3.57% | 1,006,433 | 938,195 | 24,042 | 72,937 |
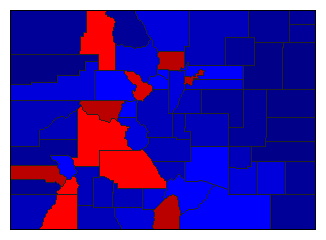
 | Secretary of State | 1,949,210 | 2 | 1 | 0 | 48,582 | 2.49% | 44.93% | 47.42% | 0.00% | 7.64% | 875,806 | 924,388 | 0 | 149,016 | |
 | State Treasurer | 1,942,342 | 2 | 1 | 0 | 98,500 | 5.07% | 44.88% | 49.95% | 0.00% | 5.17% | 871,695 | 970,195 | 0 | 100,452 | |
 | Attorney General | 1,928,513 | 2 | 1 | 0 | 177,546 | 9.21% | 42.31% | 51.51% | 0.00% | 6.18% | 815,919 | 993,465 | 0 | 119,129 |
Colorado Results for 2014
Login
© Dave Leip's Atlas of U.S. Elections, LLC 2019 All Rights Reserved
Note: The advertisement links below may advocate political positions that this site does not endorse.
Login
© Dave Leip's Atlas of U.S. Elections, LLC 2019 All Rights Reserved
Note: The advertisement links below may advocate political positions that this site does not endorse.