Home
2024
Election Results
Election Info
Weblog
Forum
Wiki
Search
Email
Login
Site Info
Store
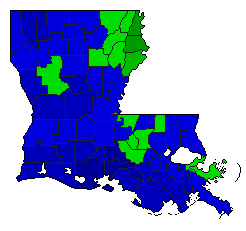
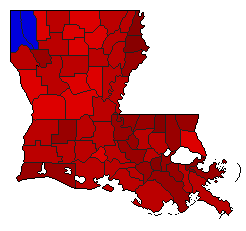
Attorney General General Election Results Comparison - Louisiana
Note: The Google advertisement links below may advocate political positions that this site does not endorse.
Map
Pie
Year
Total
D
R
I
Margin
%Margin
Dem
Rep
Ind
Oth.
Dem
Rep
Ind
Other
2015
1,084,302
0
1
2
136,564
12.59%
0.00%
56.30%
43.70%
0.00%
0
610,433
473,869
0
2007
717,059
1
2
0
238,089
33.20%
66.60%
33.40%
0.00%
0.00%
477,574
239,485
0
0
Louisiana Results for 2015
Login
Terms of Use
-
DCMA Policy
-
Privacy Policy and Cookies
©
Dave Leip's Atlas of U.S. Elections, LLC 2019 All Rights Reserved