Note: The Google advertisement links below may advocate political positions that this site does not endorse.
| Map | Pie | Office | Total | D | R | I | Margin | %Margin | Dem | Rep | Ind | Oth. | Dem | Rep | Ind | Other | | | | | | | | | | | | | | | | | | |
|---|
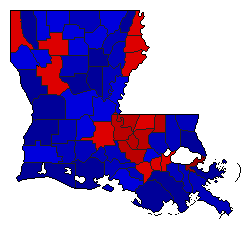
 |  | Governor |
1,152,864 |
1 |
2 |
0 |
140,984 |
12.23% |
56.11% |
43.89% |
0.00% |
0.00% |
646,924 |
505,940 |
0 |
0 |
 |  | Lt. Governor |
1,135,442 |
2 |
1 |
0 |
122,286 |
10.77% |
44.62% |
55.38% |
0.00% |
0.00% |
506,578 |
628,864 |
0 |
0 |
 |  | Attorney General |
1,084,302 |
0 |
1 |
2 |
136,564 |
12.59% |
0.00% |
56.30% |
43.70% |
0.00% |
0 |
610,433 |
473,869 |
0 |
|
