Note: The Google advertisement links below may advocate political positions that this site does not endorse.
| Map | Pie | Year | Total | D | R | I | Margin | %Margin | Dem | Rep | Ind | Oth. | Dem | Rep | Ind | Other | | | | | | | | | | | | | | | | | | |
|---|
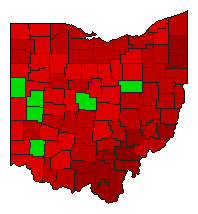
 |  | 2015 |
3,076,763 |
2 |
0 |
1 |
97,357 |
3.16% |
48.42% |
0.00% |
51.58% |
0.00% |
1,489,703 |
0 |
1,587,060 |
0 |
 | | 2011 |
3,495,335 |
1 |
0 |
2 |
792,249 |
22.67% |
61.33% |
0.00% |
38.67% |
0.00% |
2,143,792 |
0 |
1,351,543 |
0 |
|
